“
”Markets in Focus
Timely analysis of market moves and sectors of opportunity
As the outlook for recent winners remains murky, investors appear to be rotating toward favorably priced parts of the market where growth is strong or accelerating.
Consequently, the equities market is not seeing a rising tide that lifts all boats.
Given persistent volatility around headlines and the unwinding of momentum, the playbook for Matt Orton, CFA, continues to focus on diversification across sectors, industries, market capitalizations, and geographies.
The market might be moving sideways, but there is quite a bit of healthy movement beneath the surface, said Matt Orton, CFA, Chief Market Strategist at Raymond James Investment Management.
Rotation from large-cap growth into large-cap value and mid caps is providing a ballast to the market.1 There is also movement overseas into Europe and China to a lesser degree. Despite strong earnings at the top, Orton said guidance hasn’t kept pace with expectations to justify current multiples, especially given uncertainty around the future buildout of artificial intelligence (AI).
Rather than waiting and seeing, investors seem to be moving toward favorably priced parts of the market where growth remains strong or is accelerating. That includes banks, parts of healthcare like equipment and supplies, parts of industrials, and even the broader technology complex. In fact, the Nasdaq-100 Equal Weighted Index is meaningfully outperforming both the broad market and the Nasdaq 100® Index: It is up 6.26% year to date versus the 2.42% return of the S&P 500 Index and the 2.96% return of the Nasdaq 100. The rotation also includes Europe, where earnings have meaningfully surprised to the upside and valuations have been favorable relative to U.S. equities.
“What I believe is clear is that selectivity truly matters,” Orton said. “There is no rising tide lifting all boats anymore. I believe investors who lean into better diversification across sectors, industries, market capitalizations, and geographies can do well.
“This continues to be my playbook moving forward given the persistent volatility around headlines and the unwinding of momentum,” he said. “I believe there are still plenty of opportunities as investors overreact to headlines and throw good companies out with the bathwater. I have advocated for a long time that investors should avoid chasing the market higher and instead consider using downside opportunistically. And given the noisy environment we’re in right now, I believe there will be plenty of opportunities to consider for continuing to improve portfolio diversification.”
Momentum faltering while safety factors pick up steam and smaller companies build on strength
U.S. factor returns year to date
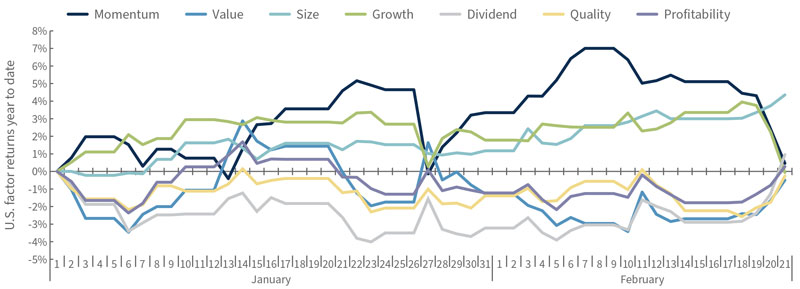
Source: Bloomberg, as of 2/21/25. Factor returns cover all equities in the U.S. market tracked by Bloomberg within the Factors to Watch (FTW) terminal function and represent the top quintile of returns within each factor less the bottom quintile of returns.
Speaking of noise, Orton said, it’s interesting to see quite weak sentiment among traditional retail investors while institutional investors remain fairly optimistic. The American Association of Individual Investors (AAII) ratio of bulls to bears is near its lowest level in two years, which Orton believes is actually a good thing for the market.
“We’re not at peak optimism,” he said, “and the general malaise in retail sentiment is probably part of the reason that we haven’t seen a strong bid for the Magnificent Seven or the AI halo trade.”
On the flip side, institutional investors remain quite bullish, embracing the resilience of the U.S. economy as well as the recent strength across Europe. Cash levels are near their lowest levels in 15 years. These low levels of cash could certainly lead to a temporary pullback should we see some uncomfortable economic or inflation data, but Orton believes this sort of dip could be a buyable opportunity given the generally strong takeaways from earnings season, including strengthening profit margins and a continued broadening of growth. Additionally, a pullback of more than 5% might be what retail investors need to start coming back into the market.
2025 year-to-date U.S. returns style box
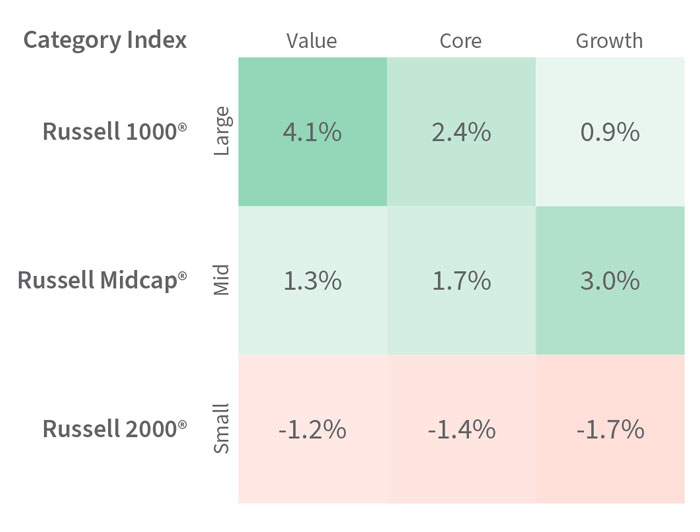
Source: Bloomberg, as of 2/21/25.
So how should investors think about positioning right now given the changes we’re seeing beneath the surface and the tug-of-war within investor sentiment? NVIDIA earnings will be critical for market direction in the near term, said Orton, who told Reuters last week that the report could be the catalyst to help improve sentiment and see the market break out once again. He also expects the German federal election to play a role in the trend of European equities. On both sides of the Atlantic, Orton said he would be careful about chasing upside. He said he would look for more days like Friday to consider leaning into the rotation that’s taking place. Areas where he sees potential opportunities include:
Financials. Global banks have displayed an earnings resilience for the past few months that Orton said continues to make them attractive. European banks have risen significantly year to date; earnings have been the catalyst coupled with valuations that are still well below those of U.S. banks. Japanese banks also have done well, but they lag their counterparts in the United States and Europe. Orton sees that as a potential opportunity as he expects the Bank of Japan to continue hiking interest rates as wage growth supports the consumer. In the United States, he said don’t forget about the prospect of increased capital markets activity — this industry within financials has been moving sideways for the past few weeks and he believes the recent weakness could present a potential entry for those who missed the trade before the U.S. election.
Healthcare. The negative headlines around a major healthcare company and pharmacy benefit managers, plus uncertainty from the Elon Musk-led Department of Government Efficiency (DOGE), mask constructive price action beneath the surface, Orton said. In fact, healthcare is the second top-contributing sector to S&P 500 gains year to date after financials. Equipment and services companies have been quite strong backed by good earnings, and they fit into the key secular growth trend of an aging population with more chronic diseases. Large-cap biotechnology also has been quite strong, and genomics appears to be breaking out, he said. If interest rates remain well behaved, Orton said strong performance can continue given how weak these two industries have been in years past.
The tech rotation. The hyperscalers have generally been rolling over as investors have been unwilling to come back with too many questions following the news around the Chinese DeepSeek AI model. Orton does not think the AI trade is over, but it is taking a breather. Meanwhile, he said, other areas within technology are shining. He has long favored cybersecurity companies within software, but it has been tough putting new money to work this year given the group’s relative strength. Orton believes the recent pullback presents a possible entry point, and he believes the strength of earnings, coupled with strong guidance and continued corporate investment, make this an attractive part of software to consider. He also sees the equal-weighted Nasdaq as a potential way to position around the broadening of the tech trade.
The global rotation can continue. But be selective. Attractive valuations have existed overseas for a long time, but that’s never led to sustained outperformance. Now earnings growth has started to follow through, but earnings per share (EPS) in Europe haven’t yet exceeded U.S. EPS, and Orton said the big question is whether they can sustain the recent momentum. The story with U.S. small caps has been similar in the past: Attractive valuations and green shoots have not been followed by consistent top- and bottom-line growth. “That said, I think there are reasons to be excited overseas right now,” he said. Aerospace and defense, one of his favorite areas in Europe for the past year, has been performing well on the clear need to increase spending, even with a Russia-Ukraine cease fire. If Germany loosens its brake on debt, higher fiscal spending could benefit more cyclical industries. But the run has been quite strong lately, and Orton cautions against piling into the trade right now.
The week starts with the results of the German federal election, to be followed by key data on consumer prices in Germany, France and Spain before the European Central Bank’s March meeting.
In the United States, the focus will be on NVIDIA earnings and the company’s guidance going forward. On the economic front, we get the second reading of U.S. fourth-quarter gross domestic product (GDP) as well as core Personal Consumption Expenditures (PCE) Price Index data for January. Pay attention as well to the Conference Board’s U.S. Consumer Confidence Survey® on Tuesday, especially in light of last week’s surge in long-term inflation expectations in the University of Michigan Index of Consumer Sentiment for February. The Confidence Survey could provide another piece of evidence if inflation expectations are indeed becoming unanchored. In addition, at least nine U.S. Federal Reserve officials will have a chance to discuss their outlooks for the economy and interest rates.
Note also that the upcoming March 1 weekend is also the end of the 30-day buffer period for new U.S. tariffs on Canada and Mexico. Markets are not reacting to tariff headlines very much anymore, which Orton said is surprising as the Trump administration is now citing tariffs as a revenue tool. He believes the administration’s focus on tariff revenue should add conviction that some sort of tariffs are coming, but clearly markets are not of this view.
1 Unless otherwise indicated, all data cited is sourced from Bloomberg as of Feb. 21, 2025.
Risk Information:
Investing involves risk, including risk of loss.
Diversification does not ensure a profit or guarantee against loss.
Disclosures:
Index or benchmark performance presented in this document does not reflect the deduction of advisory fees, transaction charges, or other expenses, which would reduce performance. Indexes are unmanaged. It is not possible to invest directly in an index. Any investor who attempts to mimic the performance of an index would incur fees and expenses that would reduce return.
This document is a general communication being provided for informational purposes only. It is educational in nature and not designed to be taken as advice or a recommendation for any specific investment product, strategy, plan feature, or other purpose in any jurisdiction, nor is it a commitment from Raymond James Investment Management or any of its affiliates to participate in any of the transactions mentioned herein. Any examples used are generic, hypothetical, and for illustration purposes only. This material does not contain sufficient information to support an investment decision, and you should not rely on it in evaluating the merits of investing in any securities or products. In addition, users should make an independent assessment of the legal, regulatory, tax, credit, and accounting implications and make their own determinations together with their own professionals in those fields. Any forecasts, figures, opinions, or investment techniques and strategies set out are for information purposes only, based on certain assumptions and current market conditions, and are subject to change without prior notice. All information presented herein is considered to be accurate at the time of production, but no warranty of accuracy is given and no liability in respect of any error or omission is accepted. It should be noted that investment involves risks, the value of investments and the income from them may fluctuate in accordance with market conditions and taxation agreements, and investors may not get back the full amount invested. Both past performance and yields are not reliable indicators of current and future results.
The views and opinions expressed are not necessarily those of the broker/dealer or any affiliates. Nothing discussed or suggested should be construed as permission to supersede or circumvent any broker/dealer policies, procedures, rules, and guidelines.
Sector investments are companies engaged in business related to a specific sector. They are subject to fierce competition and their products and services may be subject to rapid obsolescence. There are additional risks associated with investing in an individual sector, including limited diversification.
Investing in small cap stocks generally involves greater risks, and therefore, may not be appropriate for every investor. The prices of small company stocks may be subject to more volatility than those of large company stocks.
International investing presents specific risks, such as currency fluctuations, differences in financial accounting standards, and potential political and economic instability. These risks are further accentuated in emerging market countries where risks can also include possible economic dependency on revenues from particular commodities or on international aid or development assistance, currency transfer restrictions, and liquidity risks related to lower trading volumes.
Definitions
The American Association of Individual Investors Sentiment Survey reflects answers offered each week by AAII members to the question: What direction do they feel the stock market will take in the next six months? Answers are sorted into bullish, neutral, and bearish categories. The survey’s ratio of bulls to bears is calculated by subtracting bullish responses from bearish responses.
Ballast, in finance, can refer to characteristics, factors or trading strategies that mitigate volatility or provide stability to a security or group of securities.
The Bloomberg Factors to Watch (FTW) function allows a Bloomberg terminal subscriber to monitor the performance of a variety of market factors over a range of time periods and to analyze how individual factors have driven returns historically. Factor data accessible via the FTW function includes value, size, growth, dividend, quality, and profitability factors.
The U.S. Consumer Confidence Survey®, published monthly by The Conference Board, reflects prevailing business conditions and likely developments for coming months based on consumer attitudes, buying intentions, vacation plans, and expectations for inflation, stock prices, and interest rates.
Core PCE, officially known as the Personal Consumption Expenditures (PCE) excluding Food and Energy, Price Index, is a measure of the prices that U.S. consumers pay for goods and services, not including two categories — food and energy — where prices tend to swing up and down more dramatically and more often than other prices. The core PCE price index, released monthly by the U.S. Department of Commerce Bureau of Economic Analysis, measures inflation trends and is watched closely by the U.S. Federal Reserve as it conducts monetary policy.
Cyclical stocks have prices influenced by macroeconomic changes in the economy and are known for following the economy as it cycles through expansion, peak, recession, and recovery.
DeepSeek is a Chinese artificial intelligence startup that in January 2025 became a leading free downloadable app in the United States. This followed DeepSeek’s announcement that its AI model performed as well as market-leading models, and that it was developed at a significantly lower cost. This led to a selloff of well-known U.S. technology stocks on Jan. 27, 2025.
Earnings per share (EPS) is calculated as a company’s profit divided by the outstanding shares of its common stock. The resulting number serves as an indicator of a company’s profitability.
Factor investing is an approach to investing that selects securities based on characteristics associated with higher returns. These characteristics, or factors, can be macroeconomic factors or style factors. Macroeconomic factors are focused on broad risks across asset classes and include the rate of inflation: growth in gross domestic product; and the unemployment rate. Style factors include differences in growth versus value stocks; market capitalization, and industry sector. Factor performance refers to a focus on performance of securities within a particular factor or between groups of different kinds of factors.
Gross domestic product (GDP) is the total value of goods and services provided in an economy during a specified period, often one quarter or one year.
Growth investing is a stock-buying strategy that focuses on companies expected to grow at an above-average rate compared to their industry or the market.
Guidance refers statements from the managers of publicly traded companies that indicate whether they expect to realize near-term profits or losses and why.
The halo effect in finance reflects a market participant’s inclination to favor a particular company, group of securities, industry, sector, or other area of the market based on previous good experience with the company or group. A halo trade is one influenced by the halo effect.
Hyperscalers refers to the largest cloud computing providers that can provide massive amounts of computing resources and storage at enterprise scale.
The Magnificent Seven refers to the seven largest stocks by market capitalization in the S&P 500 Index, as of Dec. 31, 2024. Collectively they made up more than 25% of the market capitalization of the entire index. They are Alphabet, Amazon.com, Apple, Meta Platforms, Microsoft, NVIDIA and Tesla.
Market capitalization, or market cap, refers to the total dollar market value of a company’s outstanding shares of stock.
Momentum investing is a strategy that aims to capitalize on the continuance of an existing market trend. It is a trading strategy in which investors buy securities that are already rising and look to sell them when they look to have peaked. It entails taking long positions on financial instruments with prices trending up and short positions on instruments with prices trending down.
A multiple, sometimes referred to as the price multiple or earnings multiple, is a measure of a company’s value based on the ratio of its current share price to its earnings per share. This ratio is known as the price-to-earnings ratio, or P/E.
Positioning refers to assessments of whether professional investors are, on the whole, bullish or bearish on a particular security, industry, sector, market capitalization or other area of the market, as reflected by the extent to which they are invested in the area of the market in question.
A pullback is a temporary pause or drop in the price of a security that previously had been rising.
A quintile is a statistical value representing 20% of a given set of data. The first, or lowest, quintile represents the lowest fifth of the data (1% to 20%), and the highest quintile represents the top fifth (81% to 100%).
Rotation describes the movement of investments in securities from one industry, sector, factor, or asset class to another as market participants react to or try to anticipate the next stage of the economic cycle.
Secular trends are large-scale and ongoing changes in economies and societies that have the potential to drive broad and lasting economic, technological, social or other kinds of changes.
Style boxes are used to group different equity investments by their key characteristics. This can include market capitalization and investment style, showing where specific investments or strategies fit into the overall market.
The University of Michigan Index of Consumer Sentiment is based on monthly telephone surveys in which at least 500 consumers in the continental United States are asked 50 questions about what they think now and what their expectations are for their personal finances, business conditions, and buying conditions. Their responses are used to calculate monthly measures of consumer sentiment that can be compared to a base value of 100 set in 1966.
Unwinding describes the process of closing out what is often a large or complicated trading position.
Value investing is an investment strategy that involves picking stocks that appear to be trading for less than their intrinsic or book value.
Indices
The S&P 500 Index measures changes in stock market conditions based on the average performance of 500 widely held common stocks. It is a market-weighted index calculated on a total return basis with dividend reinvested. The S&P 500 represents approximately 80% of the investable U.S. equity market.
The Nasdaq 100® is a stock market index made up of 103 equity securities issued by 100 of the largest non-financial companies listed on the Nasdaq stock market. It is a modified capitalization-weighted index.
The Nasdaq-100 Equal Weighted Index is an equal weighted version of the Nasdaq 100. It includes 100 of the largest non-financial stocks listed on the Nasdaq stock market based on market capitalization and is rebalanced quarterly.
The Russell 1000® Index measures the performance of the large-cap segment of the U.S. equity universe. The Russell 1000 Index is a subset of the Russell 3000® Index, which is designed to represent approximately 98% of the investable U.S. equity market. It includes approximately 1,000 ofthe largest securities based on a combination of their market cap and current index membership.
The Russell 1000® Growth Index measures a growth-oriented subset of the Russell 1000 Index, which tracks approximately 1,000 of the large-sized capitalization companies in the United States equities market.
The Russell 1000® Value Index measures a value-oriented subset of the Russell 1000® Index, which tracks approximately 1,000 of the large-sized capitalization companies in the U.S. equities market.
The Russell Midcap® Index measures the performance of the mid-cap segment of the U.S. equity universe. It includes approximately 800 of the smallest securities of the Russell 1000® Index based on a combination of their market capitalization and current index membership and represents approximately 27% of the total market capitalization of the Russell 1000® Index.
The Russell Midcap® Growth Index measures the performance of the midcap growth segment of the U.S. equity universe. It includes those Russell Midcap® Index companies with higher price-to-book ratios and higher forecasted growth values.
The Russell Midcap® Value Index measures the performance of the midcap value segment of the US equity universe. It includes those Russell Midcap® Index companies with lower price-to-book ratios and lower forecasted growth values.
The Russell 2000® Index measures the performance of the small-cap segment of the US equity universe. The Russell 2000 Index is a subset of the Russell 3000® Index and includes approximately 2,000 of the smallest securities based on a combination of their market cap and current index membership.
The Russell 2000® Growth Index measures the performance of the small-cap growth segment of the U.S. equity universe. It includes those Russell 2000 companies with higher price-to-book ratios and higher forecasted growth values.
The Russell 2000® Value Index measures the performance of the small-cap value segment of the U.S. equity universe. It includes those Russell 2000 companies with lower price-to-book ratios and lower forecasted growth values.
London Stock Exchange Group plc and its group undertakings (collectively, the “LSE Group”). ©LSE Group 2025. FTSE Russell is a trading name of certain of the LSE Group companies. Russell® is a trademark of the relevant LSE Group companies and is used by any other LSE Group company under license. All rights in the FTSE Russell indexes or data vest in the relevant LSE Group company which owns the index or the data. Neither LSE Group nor its licensors accept any liability for any errors or omissions in the indexes or data and no party may rely on any indexes or data contained in this communication. No further distribution of data from the LSE Group is permitted without the relevant LSE Group company’s express written consent. The LSE Group does not promote, sponsor, or endorse the content of this communication.
M-694543 Exp. 6/24/2025
