“
”Markets in Focus
Timely analysis of market moves and sectors of opportunity
The quick pivot on E.U. tariffs has temporarily stopped a market slide, but uncertainty remains as investors await more trade deals.
Over the medium term, outflows could increase if foreign investors continue pulling funds from the U.S.
Investors may want to consider using outsized downward moves opportunistically to strengthen their diversification across asset classes, geographies, and sectors.
The latest brinksmanship between the United States and the European Union demonstrates that trade risks remain and that U.S. President Donald Trump will apply maximum pressure to secure deals. Even Apple was caught up in the re-escalation with 25% tariffs threatened on iPhones.1
“Equities were overbought and stretched heading into last week after a nearly 20% rally, so the weaker price action isn’t at all surprising,” said Matt Orton, CFA, Chief Market Strategist at Raymond James Investment Management. “What matters most is how the market deals with bad news going forward.”
This week will see the quarter’s last major earnings reports, and after that, the market could return to being primarily driven by macro catalysts. The clock is quickly ticking down on the 90-day tariff pauses that end on July 9 for “reciprocal” tariffs and August 14 for the U.S.–China de-escalation. Orton expects to see more brash announcements from the United States, in line with its recent threats against the European Union, intended to accelerate the pace of trade deals.
Long-dated yields across major bond markets have all increased meaningfully over the past few weeks, elevating potential volatility in the short term. “My base case is that we’re likely to see sideways price action across the equity complex until we get some sort of resolution on the trade front and the fiscal front at home,” Orton said. He continued to advocate for diversification in portfolios across asset classes, geographies, and sectors, and recommends that investors consider using any outsized downward moves opportunistically.
“Trade headlines continue to capture most of our attention, but it’s worth highlighting the action across global bond markets,” Orton said. Yield curves are steepening around the world with a continued focus on fiscal measures and deteriorating supply–demand dynamics. In the United States, 30-year U.S. Treasury yields have increased nearly 30 basis points (bps), and they’ve increased by 36 bps in Japan and 20 bps in Germany.
Long yields are on a rapid ascent
Change in 30-year government bond yields over the last four weeks
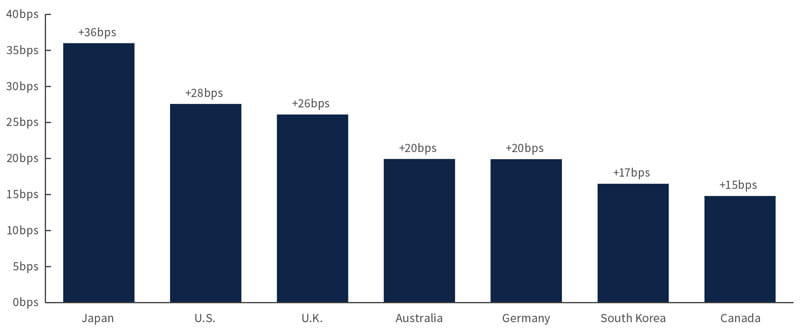
Source: Bloomberg, as of 5/23/25.
So is this as good as it gets?
Orton said that while moves in Japanese government bonds stand out, their increase is likely attributable to historically low net-buying activity from life insurers and rebalancing flows from pensions. “Action in the United States is more focused on fiscal dynamics,” he said. 30-year U.S. Treasuries are trading above 5.0%, and increased concerns around the fiscal backdrop are putting a spotlight on the tax bill passed by a narrow majority in the U.S. House of Representatives. The bill will head to the U.S. Senate with a lot of sticking points, particularly from Republican senators who are wary about cuts to healthcare programs. Both chambers need to agree on the final version, which will take time.
“The next few weeks — with the Senate discussing the tax bill — is a crucial checkpoint for the U.S. fiscal story, and possibly an inflection point for the U.S. Treasury market,” Orton said. “It could be the difference between a grey swan event in U.S. Treasuries or a stable bond market with lower yields.” Investors may see some choppy and sideways price action until later in the summer, after some resolution on the fiscal and trade fronts.
Despite the risks, Orton said it’s hard to get too negative on the equity market given earnings that were more resilient and guidance that was less apocalyptic than expectations. And the Senate’s version of the tax bill, which is expected to be even more fiscally expansionary than its House counterpart, could provide a cushion for the American consumer.
“Forget the inherent policy contradictions that exist within the current legislation and its total lack of alignment with the goals used to justify tariffs. It’s clear that we’re trying to get the economy to run hot, and equities can be a pretty good place to be in that scenario,” Orton said. If rates can find some stability around current levels — and that’s a big if, Orton noted — then he believes that small- and mid-cap companies could benefit the most.
“The market was looking for an excuse to roll over,” Orton said. “If anything, it’s healthy to see some consolidation.” In his view, there is still some digestion that needs to occur in the near term, but investors can consider plenty of areas for putting money to work that are levered to long-term secular growth themes and aligned with current policy initiatives.
Although Trump’s quick pivot on E.U. tariffs has provided some temporary relief, Orton doesn’t think it’s sufficient to set the market off to the races again. He said that allocations from discretionary investors remain very overweight to the United States, particularly in exchange-traded and mutual funds, while systematic funds — notably, commodity trading advisors (CTAs) — have been the key driver of recent U.S. equity resilience. Over the medium term, there is scope for CTA activity to slow and outflows to rise as foreign investors continue pulling funds from the U.S.
“With earnings season essentially complete once we get NVIDIA’s report this week, I think the macro will move into the driver’s seat,” Orton said. Once that happens, he suggests paying close attention to the movement of longer-dated yields for cues to other, more nascent themes across the equity market.
“Yields have also been rising for the wrong reasons, leading to a renewed sell-off of the dollar and rise in gold and bitcoin,” Orton said. In addition to owning some amount of gold for diversification, he suggested that investors consider:
Developed market movements. Europe remains a strong candidate for foreign repatriation — particularly if investors see more policy bluster — which could provide a tailwind to performance. “International developed equities, especially in Europe, have had a very strong run,” Orton said. However, he warned that selectivity would be key. “Continued fiscal concerns in the U.S., coupled with some much-needed fiscal spending from countries like Germany, could provide an additional boost.”
Emerging market opportunities. “With 30-year yields up and the dollar down, it’s a supportive environment for the emerging market complex,” Orton said. He has been optimistic about select emerging markets (EM), like India and Brazil, as additional diversification opportunities. “EM central banks are now the most dovish since Covid, and a weaker dollar will be supportive,” Orton said. He recommends that investors keep an eye on this trend and consider using dips opportunistically to increase their portfolios’ diversification.
Looking beyond large- and mega-cap companies. “It has been a tough road down market cap, but their risk/return tradeoffs look favorable,” Orton said. “Given some of the concerns around the direction of yields, and their potential impact on the price action of smaller companies, it makes sense to focus more on mid-caps as a potential opportunity right now.” In fact, the Russell Midcap Index has outperformed the S&P 500 Index year to date.
Wednesday’s NVIDIA earnings are expected to be a significant market driver in a shortened trading week. On the economic front, the focus will be on consumer confidence indices and inflation data. The Conference Board Consumer Confidence Index® will shed light on how consumers are processing developments in the trade war. We will also get April Personal Consumption Expenditures (PCE) data for the United States. The May Federal Open Market Committee minutes will be released on Wednesday. And on Thursday, U.S. Federal Reserve (Fed) officials will present views from across the hawk–dove spectrum with public remarks from Tom Barkin, president of the Federal Reserve Bank of Richmond; Austan D. Goolsbee, president of the Federal Reserve Bank of Chicago; Mary C. Daly, president of the Federal Reserve Bank of San Francisco; and Lorie K. Logan, president of the Federal Reserve Bank of Dallas.
1 Unless otherwise indicated, all data cited is sourced from Bloomberg as of May 23, 2025.
Risk Information:
Investing involves risk, including risk of loss.
Diversification does not ensure a profit or guarantee against loss.
Disclosures:
Link(s) are being provided for informational purposes only. Raymond James Investment Management is not affiliated with and does not endorse, authorize or sponsor any of the listed websites or their respective sponsors. Raymond James Investment Management is not responsible for the content of any website or the collection or use of information regarding any website’s users and/or members
Index or benchmark performance presented in this document does not reflect the deduction of advisory fees, transaction charges, or other expenses, which would reduce performance. Indexes are unmanaged. It is not possible to invest directly in an index. Any investor who attempts to mimic the performance of an index would incur fees and expenses that would reduce return.
This document is a general communication being provided for informational purposes only. It is educational in nature and not designed to be taken as advice or a recommendation for any specific investment product, strategy, plan feature, or other purpose in any jurisdiction, nor is it a commitment from Raymond James Investment Management or any of its affiliates to participate in any of the transactions mentioned herein. Any examples used are generic, hypothetical, and for illustration purposes only. This material does not contain sufficient information to support an investment decision, and you should not rely on it in evaluating the merits of investing in any securities or products. In addition, users should make an independent assessment of the legal, regulatory, tax, credit, and accounting implications and make their own determinations together with their own professionals in those fields. Any forecasts, figures, opinions, or investment techniques and strategies set out are for information purposes only, based on certain assumptions and current market conditions, and are subject to change without prior notice. All information presented herein is considered to be accurate at the time of production, but no warranty of accuracy is given and no liability in respect of any error or omission is accepted. It should be noted that investment involves risks, the value of investments and the income from them may fluctuate in accordance with market conditions and taxation agreements, and investors may not get back the full amount invested. Both past performance and yields are not reliable indicators of current and future results.
The views and opinions expressed are not necessarily those of the broker/dealer or any affiliates. Nothing discussed or suggested should be construed as permission to supersede or circumvent any broker/dealer policies, procedures, rules, and guidelines.
Sector investments are companies engaged in business related to a specific sector. They are subject to fierce competition and their products and services may be subject to rapid obsolescence. There are additional risks associated with investing in an individual sector, including limited diversification.
Investing in small cap stocks generally involves greater risks, and therefore, may not be appropriate for every investor. The prices of small company stocks may be subject to more volatility than those of large company stocks.
International investing presents specific risks, such as currency fluctuations, differences in financial accounting standards, and potential political and economic instability. These risks are further accentuated in emerging market countries where risks can also include possible economic dependency on revenues from particular commodities or on international aid or development assistance, currency transfer restrictions, and liquidity risks related to lower trading volumes.
Investing in bonds involves risks that may adversely affect the value of your investment such as inflation risk, credit risk, call risk, interest rate risk, and liquidity risk, among others. The two most prominent factors are interest rate movements and the credit worthiness of the bond issuer. Investors should pay careful attention to the types of fixed income securities that comprise their portfolios and remember that, as with all investments, there is the risk of loss of capital.
Bond Ratings: Ratings are by Moody’s, S&P, and/or Fitch. Ratings provided by nationally recognized statistical rating organizations, also called ratings agencies, are appraisals of a particular issuer’s creditworthiness, including the possibility that the issuer will not be able to pay interest or repay principal. Ratings are not recommendations to buy, sell or hold a security, nor do ratings remove market risk. Securities with the same rating can actually trade at significantly different prices. In addition, ratings are subject to review, revision, suspension, reduction or withdrawal at any time, and a rating agency may place an issuer under review or credit watch. Additionally, Fitch reports are available for municipal bonds. More about ratings is available at moodys.com, standardandpoors.com, and fitchratings.com.
Definitions
Basis points (bps) are measurements used in discussions of interest rates and other percentages in finance. One basis point is equal to 1/100th of 1%, or 0.01%.
Commodity trading advisors (CTAs) are investment professionals or firms that provide client-specific advice on buying and selling futures contracts.
The Conference Board Consumer Confidence Index® is a survey administered by The Conference Board that measures how optimistic or pessimistic consumers are regarding their expected financial situation.
Consolidation is a term used in technical analysis to describe when stocks reverse previous gains (or losses) to stay within well-defined trading levels.
The Federal Open Market Committee (FOMC) consists of 12 members: the seven members of the Board of Governors of the Federal Reserve System; the president of the Federal Reserve Bank of New York; and four of the remaining 11 Reserve Bank presidents, who serve one-year terms on a rotating basis. The FOMC holds eight regularly scheduled meetings per year at which it reviews economic and financial conditions, determines the appropriate stance of monetary policy, and assesses the risks to its long-run goals of price stability and sustainable economic growth. The FOMC observes a blackout period, which begins at midnight of the second Saturday before each meeting. During the blackout periods, committee members do not make public comments about macroeconomic developments or monetary policy issues.
Fund flow is the net of all cash inflows and outflows into and out of a particular financial asset, sector, or index. It typically is measured on a quarterly or monthly basis. Investors and others look at the direction of fund flows for indications about the health of specific securities and sectors or the overall market.
A grey swan event is foreseeable and predictable but unlikely to occur. It is different from a black swan event, which cannot be predicted. Grey swan and black swan events both have substantial and far-reaching effects when they occur.
Hawkish, dovish, and centrist are terms used to describe the monetary policy preferences of central bankers and others. Hawks prioritize controlling inflation and may favor raising interest rates to reduce it or keep it in check. Doves tend to support maintaining lower interest rates, often in support of stimulating job growth and the economy more generally. Centrists tend to occupy the middle of the continuum between tight (hawkish) and loose (dovish) monetary policy.
Companies that are levered to long-term secular growth themes have earnings that directionally follow the expansion of those themes.
Market capitalization, or market cap, refers to the total dollar market value of a company’s outstanding shares of stock.
Overbought is a term used to describe a security or group of securities believed to be trading at a level above its or their intrinsic or fair value.
Overweight describes a portfolio position in an industry sector or some other category that is greater than the corresponding weight level in a benchmark portfolio.
The Personal Consumption Expenditures (PCE) Price Index is a measure of the prices that people living in the United States, or those buying on their behalf, pay for goods and services. The PCE price index, released monthly by the U.S. Department of Commerce Bureau of Economic Analysis, is known for capturing inflation or deflation across a wide range of consumer expenses and reflecting changes in consumer behavior.
Secular growth trends are large-scale and ongoing changes in economies and societies that have the potential to drive broad and lasting economic, technological, social or other kinds of changes.
Tailwind is a term used to describe events or market forces that exert a positive influence on an investment’s performance. The opposite of a tailwind is a headwind, which contributes to an investment’s underperformance.
A yield curve is a line that plots yields (interest rates) of bonds having equal credit quality but differing maturity dates. The slope of the yield curve gives an idea of future interest rate changes and economic activity. A steepening yield curve results from a widening in the difference between short- and long-term interest rates. A steepening curve can reflect an expectation of stronger economic activity, rising inflation, and rising interest rates.
Indices
The S&P 500 Index measures changes in stock market conditions based on the average performance of 500 widely held common stocks. It is a market-weighted index calculated on a total return basis with dividend reinvested. The S&P 500 represents approximately 80% of the investable U.S. equity market.
The Russell Midcap® Index measures the performance of the mid-cap segment of the U.S. equity universe. It includes approximately 800 of the smallest securities of the Russell 1000® Index based on a combination of their market capitalization and current index membership and represents approximately 27% of the total market capitalization of the Russell 1000® Index.
The Russell 1000® Index measures the performance of the 1,000 largest companies in the Russell 3000® Index, which represents approximately 98% of the total market capitalization of the Russell 3000® Index.
The Russell 3000® Index measures the performance of the 3,000 largest U.S.-traded stocks, which represent about 96% of the total market capitalization of all U.S. incorporated equity securities.
London Stock Exchange Group plc and its group undertakings (collectively, the “LSE Group”).© LSE Group 2025. FTSE Russell is a trading name of certain of the LSE Group companies. Russell® is a trade mark of the relevant LSE Group companies and is used by any other LSE Group company under license. All rights in the FTSE Russell indexes or data vest in the relevant LSE Group company which owns the index or the data. Neither LSE Group nor its licensors accept any liability for any errors or omissions in the indexes or data and no party may rely on any indexes or data contained in this communication. No further distribution of data from the LSE Group is permitted without the relevant LSE Group company’s express written consent. The LSE Group does not promote, sponsor, or endorse the content of this communication.
M-747297 Exp. 9/27/2025
Equity market momentum remains strong even though the market is stretched.
Matt Orton, CFA, wouldn’t be surprised to see a shallow pullback triggered by events such as the Moody’s downgrade of U.S. debt, comments from President Trump, or maneuvering around the Republicans’ tax and policy bill.
In this environment, Orton cautions against chasing the market higher, but instead focusing on potential opportunities for portfolio diversification, including a balanced approach to growth and international markets.
Despite ongoing macroeconomic uncertainty, equities have staged a remarkable recovery since their lows following President Trump’s Liberation Day tariff announcements. Recent policy pivots have eased fears of worst-case scenarios, while much stronger than expected earnings have fueled optimism that the corporate sector has the strength and resiliency to weather an uncertain environment. The S&P 500 Index has rallied just under 20% from its low on April 8 and now sits 3% below all-time highs.1
At the same time, yields have moved higher with the 10-year U.S. Treasury yield rising nearly 50 basis points over the last month. This unique environment has created meaningful divisions between the bulls and the bears, as seen in positioning and sentiment data.
“I believe this division creates potential opportunities for investors who remain neutral in this emotionally charged macro environment,” said Matt Orton, CFA, Chief Market Strategist at Raymond James Investment Management. “There are anomalies everywhere you look – perhaps most notably in the near-historic divergence between hard and soft data – but it’s dangerous to let emotions guide investment decisions around how or if these anomalies are resolved.”
For now, Orton continues to believe that the “pain trade” – market movements that deliver widespread discomfort to investors – is higher as equities continue to rise.
“Is the market stretched?” he said. “Absolutely. But positioning is neutral and sentiment remains quite low, which makes sense given how many bears are still out there. Meanwhile, I expect trend-following investors like commodity trading advisors (CTAs) to remain potential buyers as volatility compresses.”
Any good news is likely to squeeze the market higher, Orton said. He continues to advocate for to leaning into diversification – across asset classes, geographies, and sectors or industries – while resisting the urge to chase the market higher.
With a drawdown now of only 3%, could a fresh all-time high be on the horizon?
S&P 500 drawdowns since the beginning of 2020
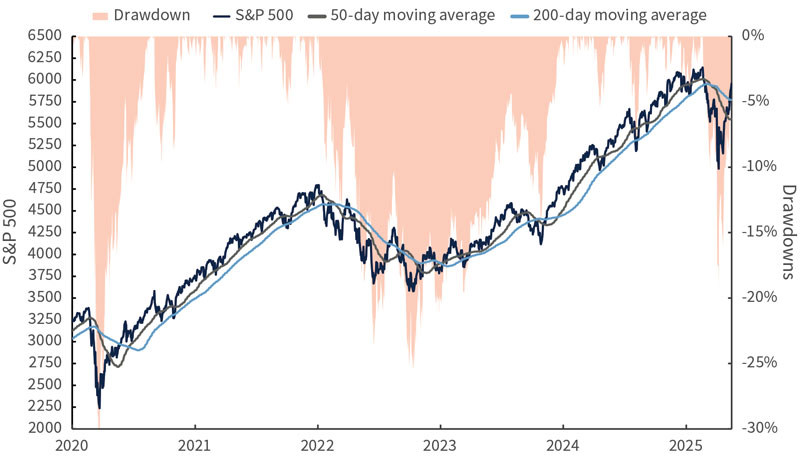
Source: Bloomberg, as of 5/16/25.
So is this as good as it gets?
It’s a fair question given the strength of the rally, Orton said. The environment remains extremely uncertain and trade détentes, while positive in the near term, don’t lock in further de-escalation. The effective tariff rate has been cut in half following progress with China, but it remains nearly 10% higher than it was two months ago, which likely will have an impact on growth and inflation. It’s also not clear if the administration’s policy objectives have truly changed, or whether this is just a break as it seeks a grand global economic reordering. Orton believes the uncertainty and reputational damage from the rollout of tariffs will be even harder to reverse – if that’s even possible.
“I think all of these concerns are quite valid,” he said. “There are still meaningful risks that remain unresolved. But we also need to recognize that the policy pivots from the White House have been significant and have occurred faster than many expected.
That signals that there is in fact some sensitivity to the financial markets, even if it nearly took a financial crisis to get a reaction.”
Even if the effective tariff rate stabilizes somewhere near 10%, Orton believes this doesn’t mean recession is inevitable. The hard data doesn’t necessarily have to fall in line with the more pessimistic soft data. That’s what we’re seeing right now, he said, especially given the resilience of the jobs market, the consumer, and the corporate sector. The biggest risk is additional change to the trend in policy pivots or a surprise rift with the Chinese through the negotiating process.
“That’s why I believe investors should consider embracing diversification rather than avoiding risk entirely,” he said.
Last week we were also reminded of other key policy objectives from the current administration, notably tax reform. The rates market is certainly sending a signal of caution around the fiscal profligacy that’s embedded in the legislation that Trump and Republicans are calling “The One, Big, Beautiful Bill,” but Orton sees any certainty we get with respect to the extension of the Tax Cuts and Jobs Act of 2017 as a net positive for the equity markets in the near term. He also would look out for an increased focus on pushing forward with deregulatory goals, which he also sees as a net positive for equities. Any meaningful rise in bond yields from here also could present investors with a possible opportunity to consider adding duration. The bond vigilantes are far from coming out, and the perception of a foreign buyer strike is simply that – a perception, he said. Treasury auction demand, the U.S. Federal Reserve’s custody holdings, and – most recently – data from Japan show no dent in foreign demand for Treasuries since Liberation Day. Orton continues to prefer equities over Treasuries, but he views this as an attractive environment for opportunistic investors who are seeking ways to diversify portfolios.
There’s a lot to like about current market trends, Orton said. Technically, momentum remains strong even though the market is stretched. Orton said he wouldn’t be surprised to see a shallow pullback, and a pause or healthy consolidation could be another check for the bulls. With the Moody’s downgrade to U.S. debt, Trump back home and perhaps more inclined to post to Truth Social, and Republicans looking to pass their reconciliation bill, there could be plenty of reasons for a pullback. Still, Orton believes the market’s bias remains to the upside.
Key resistance levels have been surpassed while economic data has largely been benign to positive for growth and inflation. The equities market also is coming off an unusually strong earnings season with growth in earnings per share nearly doubling what was expected at the end of the first quarter. All of this supports Orton’s view that investors should avoid chasing the market now, and instead should think about using downside opportunities to consider adding to diversification and to parts of the market that are levered to long-term durable secular growth themes. Here are some parts of the market that he believes look interesting:
Growth, but with balance. Orton has emphasized potential opportunities created by the significant underperformance of growth following the DeepSeek shock in January and accelerated by the Liberation Day tariff announcement. Strong earnings, resilient margins, and some helpful policy pivots have led information technology to be the top-performing sector since the market lows, with multiple stocks that serve as bellwethers for their sectors up double-digits last week alone. These sorts of gains might not be sustainable, but Orton said he would continue to think about leaning into higher-beta parts of the market. While the Magnificent Seven may have stolen our attention, the S&P 500® Equal Weight Index has performed well, trailing the cap-weighted index by only 2%: up 17.74% versus a 19.75% gain for the S&P 500 since April 8. Financials have been the second-best contributing sector to S&P 500 performance, with strength across the board, especially in banks and consumer finance. Industrials have also performed quite well, again with broad-based strength across industry groups (electrical equipment companies remain attractive, Orton said). All of this shows how important it is to use downside opportunistically, he said, but also that balance could continue to work quite well, even in a market that might feel very concentrated at the top.
Global opportunities remain. Orton remains optimistic about adding global exposure to portfolios. This is not a short-term strategy, he said. Instead, he sees it as a sustainable shift as capital flows become more balanced. The MSCI ACWI-ex U.S. Index is up over 13% year to date while the S&P 500 has just returned to positive territory. Europe has done a lot of heavy lifting for developed markets, but Orton said many other countries also stand out. Seven markets hit new 2025 highs last week (Mexico, Spain, South Africa, Italy, Canada, India, and Brazil), with the first five setting five-year highs.2 The weaker dollar certainly helps many of these markets, but Orton said the moves are largely due to idiosyncratic drivers related to economic growth and the earnings for underlying country securities. He sees banks in particular as a potential area to think about putting money to work on weakness, especially in Europe. He has favored this part of the market throughout 2025, and despite the strong gains, he believes banks remain attractive given notably strong earnings and positioning that is finally starting to reflect this outperformance. Orton believes there is still room for investor positioning and any marginally positive economic news to lead banks higher.
Macroeconomic data: Preliminary May S&P Global Purchasing Managers’ Index data from the United States, Europe and Asia will provide a timely update for investors on how President Trump’s trade policies are impacting the global economy. Industrial production and retail sales data from China will be closely watched, as will U.K. inflation and the German ZEW Financial Market Survey.
Federal Reserve commentary: Orton thinks John C. Williams, Lorie Logan, Alberto Musalem, and Beth Hammack – the presidents of the Federal Reserve Banks of New York, Dallas, St. Louis, and Cleveland, respectively – will likely be the market-relevant speakers.
Earnings: Two big box retailers could provide important updates on the state of the consumer, the impact of tariffs on supplies, and how management is thinking about navigating margins in the short term.
1 Unless otherwise indicated, all data cited is sourced from Bloomberg as of May 16, 2025.
2 Returns as of May 16, 2025 based on the following indexes, which correspond to the countries in the order that they were mentioned: S&P/BMV Total Mexico Index (Mexico), IBEX 35® (Spain), FTSE/JSE Top 40 Index (South Africa), FTSE MIB (Italy), S&P/TSX Composite Index (Canada), NIFTY 50 (India), and Bovespa Index (Brazil).
Risk Information:
Investing involves risk, including risk of loss.
Diversification does not ensure a profit or guarantee against loss.
Disclosures:
Link(s) are being provided for informational purposes only. Raymond James Investment Management is not affiliated with and does not endorse, authorize or sponsor any of the listed websites or their respective sponsors. Raymond James Investment Management is not responsible for the content of any website or the collection or use of information regarding any website’s users and/or members
Index or benchmark performance presented in this document does not reflect the deduction of advisory fees, transaction charges, or other expenses, which would reduce performance. Indexes are unmanaged. It is not possible to invest directly in an index. Any investor who attempts to mimic the performance of an index would incur fees and expenses that would reduce return.
This document is a general communication being provided for informational purposes only. It is educational in nature and not designed to be taken as advice or a recommendation for any specific investment product, strategy, plan feature, or other purpose in any jurisdiction, nor is it a commitment from Raymond James Investment Management or any of its affiliates to participate in any of the transactions mentioned herein. Any examples used are generic, hypothetical, and for illustration purposes only. This material does not contain sufficient information to support an investment decision, and you should not rely on it in evaluating the merits of investing in any securities or products. In addition, users should make an independent assessment of the legal, regulatory, tax, credit, and accounting implications and make their own determinations together with their own professionals in those fields. Any forecasts, figures, opinions, or investment techniques and strategies set out are for information purposes only, based on certain assumptions and current market conditions, and are subject to change without prior notice. All information presented herein is considered to be accurate at the time of production, but no warranty of accuracy is given and no liability in respect of any error or omission is accepted. It should be noted that investment involves risks, the value of investments and the income from them may fluctuate in accordance with market conditions and taxation agreements, and investors may not get back the full amount invested. Both past performance and yields are not reliable indicators of current and future results.
The views and opinions expressed are not necessarily those of the broker/dealer or any affiliates. Nothing discussed or suggested should be construed as permission to supersede or circumvent any broker/dealer policies, procedures, rules, and guidelines.
Sector investments are companies engaged in business related to a specific sector. They are subject to fierce competition and their products and services may be subject to rapid obsolescence. There are additional risks associated with investing in an individual sector, including limited diversification.
Investing in small cap stocks generally involves greater risks, and therefore, may not be appropriate for every investor. The prices of small company stocks may be subject to more volatility than those of large company stocks.
International investing presents specific risks, such as currency fluctuations, differences in financial accounting standards, and potential political and economic instability. These risks are further accentuated in emerging market countries where risks can also include possible economic dependency on revenues from particular commodities or on international aid or development assistance, currency transfer restrictions, and liquidity risks related to lower trading volumes.
Investing in bonds involves risks that may adversely affect the value of your investment such as inflation risk, credit risk, call risk, interest rate risk, and liquidity risk, among others. The two most prominent factors are interest rate movements and the credit worthiness of the bond issuer. Investors should pay careful attention to the types of fixed income securities that comprise their portfolios and remember that, as with all investments, there is the risk of loss of capital.
Bond Ratings: Ratings are by Moody’s, S&P, and/or Fitch. Ratings provided by nationally recognized statistical rating organizations, also called ratings agencies, are appraisals of a particular issuer’s creditworthiness, including the possibility that the issuer will not be able to pay interest or repay principal. Ratings are not recommendations to buy, sell or hold a security, nor do ratings remove market risk. Securities with the same rating can actually trade at significantly different prices. In addition, ratings are subject to review, revision, suspension, reduction or withdrawal at any time, and a rating agency may place an issuer under review or credit watch. Additionally, Fitch reports are available for municipal bonds. More about ratings is available at moodys.com, standardandpoors.com, and fitchratings.com.
Definitions
Basis points (bps) are measurements used in discussions of interest rates and other percentages in finance. One basis point is equal to 1/100th of 1%, or 0.01%.
Beta is a measure of the volatility or systemic risk of a security, group of securities, or portfolio compared with another security, group of securities, portfolio, or the market as a whole.
Bond vigilantes engage in trading activity that signals their disagreement with a bond issuer’s monetary or fiscal policies. Bond vigilantes are said to enforce fiscal discipline by selling a government’s bonds to increase yields and raise borrowing costs.
Buyers’ strike in fixed income refers to a slowdown or cessation in demand for bonds, which leads to lower bond prices and higher bond yields.
Commodity trading advisors (CTAs) are investment professionals or firms that provide client-specific advice on buying and selling futures contracts.
Concentration is a term used to describe the extent to which investments in a portfolio, group of portfolios, industry, sector, index, or particular geography or clustered in groups that share specific factors or other characteristics.
DeepSeek is a Chinese artificial intelligence startup that in January 2025 became a leading free downloadable app in the United States. This followed DeepSeek’s announcement that its AI model performed as well as market-leading models and that it was developed at a significantly lower cost. This led to a selloff of well-known U.S. technology stocks on Jan. 27, 2025.
A drawdown is a decline in the returns of a security or group of securities, as measured over a period from the peak of returns to their trough.
Duration incorporates a bond’s yield, coupon, final maturity, and call features into one number, expressed in years, that indicates how price-sensitive a bond or portfolio is to changes in interest rates. Bonds with higher durations carry more risk and have higher price volatility than bonds with lower durations.
Earnings per share (EPS) is calculated as a company’s profit divided by the outstanding shares of its common stock. The resulting number serves as an indicator of a company’s profitability.
Effective tariff rates reflect the nominal tariff rates placed on imported products as well as tariffs imposed on imported materials or components used to produce final goods.
Fund flow is the net of all cash inflows and outflows into and out of a particular financial asset, sector, or index. It typically is measured on a quarterly or monthly basis. Investors and others look at the direction of fund flows for indications about the health of specific securities and sectors or the overall market.
Growth investing is a stock-buying strategy that focuses on companies expected to grow at an above-average rate compared to their industry or the market.
Liberation Day is a term used by President Donald Trump to refer to April 2, 2025, when he announced a wide range of unexpectedly high tariffs on many U.S. trading partners, triggering a global selloff of risk assets.
The Magnificent Seven refers to the seven largest stocks by market capitalization in the S&P 500 Index, as of Dec. 31, 2024. Collectively they made up more than 25% of the market capitalization of the entire index. They are Alphabet, Amazon.com, Apple, Meta Platforms, Microsoft, NVIDIA and Tesla.
Momentum stocks benefit from the continuance of an existing and often accelerating market trend. In momentum trading, investors buy securities that are already rising and look to sell them when they look to have peaked. This strategy entails taking long positions on financial instruments with prices trending up and short positions on instruments with prices trending down.
The moving average (MA) is a technical analysis tool that smooths out stock price data by creating a constantly updated average price, often over a specified period of time, such as 15, 30, 50, 100, or 200 days.
The One, Big, Beautiful Bill refers to a proposed congressional bill that would raise the U.S. debt ceiling by $4 trillion, as well as make permanent tax cuts created by the Tax Cuts and Jobs Act of 2017, change a wide range of other aspects of federal tax policy, eliminate taxes on tips, overtime, car loan interest, make changes to health insurance legislation, phase out or reduce credits for clean energy production or use, and remove tax benefits for illegal immigrants, among other things.
Pain trade refers to trades, market movements, or asset classes where investor positioning – often crowded as investors have moved en masse into a particular strategy – becomes increasingly uncomfortable for investors to pursue or maintain on a widespread basis.
Positioning refers to assessments of whether professional investors are, on the whole, bullish or bearish on a particular security, industry, sector, market capitalization or other area of the market, as reflected by the extent to which they are invested in the area of the market in question.
A pullback is a temporary pause or drop in the price of a security that previously had been rising.
A resistance level represents a price point that an asset has had trouble exceeding in the time period being considered.
Secular trends are large-scale and ongoing changes in economies and societies that have the potential to drive broad and lasting economic, technological, social or other kinds of changes.
S&P Global Purchasing Managers’ IndexTM (PMI) surveys provide monthly indicators that track economic trends in more than 40 countries and regions, including the Eurozone.
Tactical trading refers to relatively short-term investing decisions made in response to expected trends or changes in the market based on fundamental and technical analysis.
The Tax Cuts and Jobs Act (TCJA) of 2017 was a sweeping revision of the U.S. tax code that reduced taxes for individuals and businesses. The changes for businesses created a single flat corporate tax rate of 21% and also affected deductions, depreciation, expensing, tax credits, and other tax items that affect businesses. The corporate tax cut is permanent. The individual tax cuts are scheduled to expire in 2025.
Technicals refers to technical indicators of historic market data, including price and volume statistics, to which analysts apply a wide variety of mathematical formulas in their study of larger market patterns.
The ZEW Financial Market Survey is produced monthly by the Zentrum für Europäische Wirtschaftsforschung (the Center for European Economic Research) and is based on a survey of about 350 economists and analysts on the economic future of Germany in the medium term.
Indices
The S&P 500 Index measures changes in stock market conditions based on the average performance of 500 widely held common stocks. It is a market-weighted index calculated on a total return basis with dividend reinvested. The S&P 500 represents approximately 80% of the investable U.S. equity market.
The S&P 500® Equal Weight Index is the equal-weight version of the S&P 500. It includes the same constituents as the capitalization-weighted S&P 500, but each company in the S&P 500 Equal Weight Index is allocated a fixed weight, or 0.2% of the index total at each quarterly rebalance.
The MSCI ACWI (All Country World Index) ex USA Index captures large- and mid-cap representation across 22 of 23 developed markets countries (excluding the United States) and 24 emerging markets countries. With 2,056 constituents, the index covers approximately 85% of the global equity opportunity set outside the United States. Developed markets countries include Australia, Austria, Belgium, Canada, Denmark, Finland, France, Germany, Hong Kong, Ireland, Israel, Italy, Japan, Netherlands, New Zealand, Norway, Portugal, Singapore, Spain, Sweden, Switzerland and the U.K. Emerging markets countries include Brazil, Chile, China, Colombia, Czech Republic, Egypt, Greece, Hungary, India, Indonesia, Korea, Kuwait, Malaysia, Mexico, Peru, Philippines, Poland, Qatar, Saudi Arabia, South Africa, Taiwan, Thailand, Turkey and United Arab Emirates.
The S&P/BMV Total Mexico Index is designed to serve as a broad benchmark for the Mexican equities market. The index is designed to measure the performance of Mexico-domiciled stocks, including real estate investment trusts (Fideicomiso de Inversión en Bienes Raíces or FIBRAS) and mortgage trusts, that are listed on the BMV and meet certain size and liquidity criteria.
The IBEX 35®, the main index of the Spanish stock market, consists of the 35 most liquid stocks in the Spanish continuous market. The index includes the most representative companies from various sectors, such as banking, energy, and telecommunications.
The FTSE/JSE Top 40 Index is designed to represent the performance of South African companies, providing investors with a comprehensive and complementary set of indices, which measure the performance of the major capital and industry segments of the South African market. The FTSE/JSE Top 40 Index consists of the largest 40 companies ranked by investable market value in the FTSE/JSE All-Share Index.
The FTSE MIB is the primary benchmark Index for the Italian equity markets. The Index is comprised of highly liquid, leading companies across Industry Classification Benchmark (ICB) sectors in Italy. The FTSE MIB Index measures the performance of 40 Italian equities and seeks to replicate the broad sector weights of the Italian stock market. The Index is derived from the universe of stocks trading on the Borsa Italiana main equity market. Each stock is analyzed for size and liquidity, and the overall Index has appropriate sector representation. The FTSE MIB Index is market cap-weighted after adjusting constituents for float.
The S&P/TSX Composite Index is a market-weighted index that reflects the broad market performance of the Canadian equity market. It includes more than 220 Canadian companies listed on the Toronto Stock Exchange.
The NIFTY 50 Index is a stock index on the National Stock Exchange of India that tracks the largest assets in the Indian equity market. It is diversified across 13 sectors of the Indian economy: financial services, information technology, consumer goods, oil and gas, automobiles, telecommunications, construction, pharmaceuticals, metals, power, cement and cement products, fertilizers and pesticides, and media and entertainment.
The Bovespa Index, or Ibovespa, tracks major companies in the Brazilian capital market and accounts for about 80% of the number of trades and the financial volume of the Brazilian capital markets.
London Stock Exchange Group plc and its group undertakings (collectively, the “LSE Group”).© LSE Group 2025. FTSE Russell is a trading name of certain of the LSE Group companies. Russell® is a trade mark of the relevant LSE Group companies and is used by any other LSE Group company under license. All rights in the FTSE Russell indexes or data vest in the relevant LSE Group company which owns the index or the data. Neither LSE Group nor its licensors accept any liability for any errors or omissions in the indexes or data and no party may rely on any indexes or data contained in this communication. No further distribution of data from the LSE Group is permitted without the relevant LSE Group company’s express written consent. The LSE Group does not promote, sponsor, or endorse the content of this communication.
M-743262 Exp. 9/19/2025
First-quarter earnings reports did not meaningfully reflect the impact of tariffs, but companies are generally reporting strong results that include growing profit margins.
Markets may need to revise their estimates downward for the remainder of 2025 to accommodate changing interest rate forecasts and the eventual impact of trade deals.
What started as a painful squeeze has morphed into a melt-up across equity markets, and a reset of investor positioning could support an extension of the rally.
After a tumultuous April, markets seem to be on the road to recovery.1 Matt Orton, CFA, Chief Market Strategist for Raymond James Investment Management, has identified a few forces that could be constructive for equity investors.
Stronger than expected earnings growth coupled with meaningful White House pivots on tariff policy have added to a sense of optimism. “We may have seen the lows from this self-inflicted correction, and the market could be working through a bottoming process,” Orton said. “I’m encouraged by the price action in companies with smaller market capitalization — the Russell 2000 posted five consecutive weeks of gains — and the continuing narrowing of credit spreads.”
Small caps are on their longest weekly win streak since late 2023
Russell 2000 Index number of consecutive weekly gains since 2020
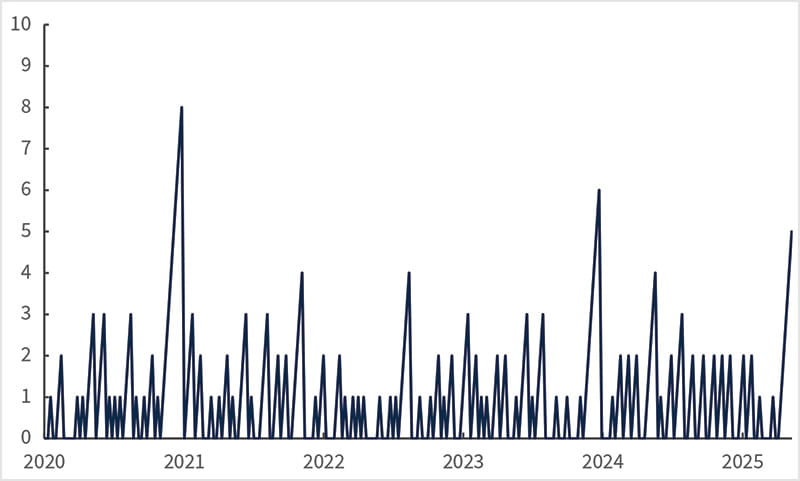
Source: Bloomberg, as of 5/9/25.
For U.S. and global equities, Orton believes that the path of least resistance remains higher, unless economic data deteriorates. However, he cautioned against chasing performance and added that he believes dips could be potential buying opportunities.
Despite the elevated uncertainty related to Tuesday’s Consumer Price Index data, Thursday’s retail sales data, and increasing expectations for trade deals, the resulting market moves may be less extreme. “Left tail risk has been significantly reduced, and the equity reaction to positive tariff news is starting to get more muted, which suggests that asymmetry is shifting slowly to the downside as positioning gets more balanced.” Orton said.
90% of S&P 500 Index companies have reported their first-quarter earnings, and the blended, year-over-year earnings growth rate for the S&P 500 is 13.4%, well ahead of the 7.1% pre-season consensus. The net profit margin stands at 12.7%. “Earnings results might not be as helpful as usual, given they do not yet meaningfully reflect the impact of tariffs, but they are still worth discussing given just how good the first quarter has been.” Orton said. “These are very strong results — especially the growing profit margins — given all the uncertainty around tariffs.”
The majority of beats were concentrated in the technology and communication services sectors, but Orton said that nearly every sector is reporting earnings-per-share growth that exceeded expectations. “Despite these great numbers, I think we can all agree that growth is going to slow, at least in the near term, as a result of pervasive uncertainty and tariff implementation, which should feed into earnings results,” he said.
“I don’t think we’ve seen quite enough of a downward revision of estimates for the remainder of 2025, and this adjustment is another potential source of risk in the near term,” Orton said. “If we continue to see progress on trade deal negotiations and additional carve-outs or pivots from the administration, any market adjustment doesn’t need to be deep or long lasting.”
While Orton remained optimistic, he said that investors need to consider some of the key risks that remain. After last week, the U.S. Federal Reserve’s (Fed’s) reluctance to come to the rescue has been front and center. Fed Chair Jerome Powell declined to say whether the most likely move for rates would be a cut or hike, indicating that the Federal Open Market Committee lacks the conviction to act. Powell repeated throughout last week’s press conference that the committee was patient and not in a hurry; he wouldn’t rule out the idea that rates might stay unchanged into 2026.
“Market expectations for this year’s rate cuts are still not aligned with the Fed,” Orton said, “and investors will have to reconcile with this reality at some point.” Reconciliation risks — coupled with complacency around tariffs — could be a source of volatility, but Orton noted that they could also be a good chance to consider redeploying capital.
Orton said that investors are rightfully enthusiastic around all of the talk of trade deals, but even the United Kingdom’s recent framework and the progress made with China still amount to meaningful increases in the effective tariff rates borne by American businesses and consumers. Over the weekend, Orton discussed these issues on CNBC’s Squawk Box Asia.
“What started as a painful squeeze has morphed into a melt-up across equity markets,” Orton said. In his view, investor positioning resetting to be more neutral could support an extension of the rally. Commodity trading advisors remain very short, which could motivate them to buy as market volatility normalizes. Buybacks are also providing a tailwind in the near term. Soft data is turning marginally more positive in the absence of deteriorating hard data, and put–call ratios, credit spreads, and implied volatility have largely returned to their levels from before Liberation Day.
Orton said that investors need to be more selective and risk-aware going into the next phase of the recovery, when dispersion will be higher. “Selectivity is critical right now, but the good news is that there seem to be plenty of opportunities across the market. I would consider building balance in portfolios — between growth and value, across geographies, and across asset classes — and explore leaning into long-term, durable secular growth themes,” he said. In addition to leaning into higher beta, cyclicals, and artificial intelligence (AI) adjacencies, he suggests that investors consider:
Continuing to balance growth and value. Most of value’s promising performance reversed after strong earnings results from hyperscalers and many software companies. Orton said that businesses affected by AI trades, like the electric equipment companies that are levered to the continued buildout of data centers, also reported strong results. “This has been a part of the market where using dips as possible buying opportunities has looked attractive, and the recovery has helped growth outperform more recently,” Orton said. However, he noted that large value sectors, like financials and large banks in particular, have posted strong earnings results and showed durability in the face of macroeconomic uncertainty. He suggested that investors consider balancing their exposure to both segments of the market.
Maintaining global diversification. U.S. equities staged a strong rally from their April 8 lows, but international equities have also been able to maintain their performance over the past weeks. “I’ve never subscribed to the notion that U.S. exceptionalism is dead, instead suggesting that Europe and other regions can also post strong performance,” Orton said. He believes that support for U.S. assets can persist from domestic and many overseas investors if they keep seeing stable economic data and re-emerging optimism around trade deals. “Let’s also not forget that the blended earnings-per-share growth rate of S&P 500 companies is 13.4% in the United States while that figure is still negative in Europe,” he said. There is scope for this to reverse, and investors are seeing encouraging signs of growth. Outside of Europe, Orton said that emerging markets can continue to benefit from a structurally weaker dollar, and he sees interesting opportunities in places like India and Latin America.
Watching for small-cap recovery.Beaten-down small caps, which were most vulnerable to steep tariffs, were Monday morning’s biggest winners after the de-escalation in China–U.S. trade tensions. The Russell 2000 Index has underperformed the Russell 1000 Index by over 500 basis points year to date (-8.90% vs. -3.32%), which gives it a lot of room to catch up. The Russell 2000 Index has also posted five consecutive weeks of gains, possibly because tariff announcements set the bar so low that most firms are now able to clear it. “If we continue to see progress on the trade front, along with a dollar that remains in a long-term downtrend, I think that sets up a very supportive near-term environment for smaller companies,” Orton said.
With earnings season largely complete, the market is going back to an environment that is driven more by macroeconomic catalysts. U.S. President Donald Trump is also headed to the Middle East this week, which could create headline risk around geopolitics and oil.
April’s U.S. Consumer Price Index data will be released on Tuesday. Several regional business and consumer confidence surveys — including the Empire State Manufacturing Survey, business outlook surveys from the Federal Reserve Bank of Philadelphia, and the University of Michigan Index of Consumer Sentiment — will be released on Thursday and Friday.
Hard data, including April’s Retail Sales Report and industrial production, will be released on Thursday. U.K. gross domestic product and wage data will also be released on Thursday, which could steer interest-rate expectations for the Bank of England. And Fed Chair Jerome Powell is scheduled to speak on Thursday.
1 Unless otherwise indicated, all data cited is sourced from Bloomberg as of May 9, 2025.
Risk Information:
Investing involves risk, including risk of loss.
Diversification does not ensure a profit or guarantee against loss.
Disclosures:
Link(s) are being provided for informational purposes only. Raymond James Investment Management is not affiliated with and does not endorse, authorize or sponsor any of the listed websites or their respective sponsors. Raymond James Investment Management is not responsible for the content of any website or the collection or use of information regarding any website’s users and/or members
Index or benchmark performance presented in this document does not reflect the deduction of advisory fees, transaction charges, or other expenses, which would reduce performance. Indexes are unmanaged. It is not possible to invest directly in an index. Any investor who attempts to mimic the performance of an index would incur fees and expenses that would reduce return.
This document is a general communication being provided for informational purposes only. It is educational in nature and not designed to be taken as advice or a recommendation for any specific investment product, strategy, plan feature, or other purpose in any jurisdiction, nor is it a commitment from Raymond James Investment Management or any of its affiliates to participate in any of the transactions mentioned herein. Any examples used are generic, hypothetical, and for illustration purposes only. This material does not contain sufficient information to support an investment decision, and you should not rely on it in evaluating the merits of investing in any securities or products. In addition, users should make an independent assessment of the legal, regulatory, tax, credit, and accounting implications and make their own determinations together with their own professionals in those fields. Any forecasts, figures, opinions, or investment techniques and strategies set out are for information purposes only, based on certain assumptions and current market conditions, and are subject to change without prior notice. All information presented herein is considered to be accurate at the time of production, but no warranty of accuracy is given and no liability in respect of any error or omission is accepted. It should be noted that investment involves risks, the value of investments and the income from them may fluctuate in accordance with market conditions and taxation agreements, and investors may not get back the full amount invested. Both past performance and yields are not reliable indicators of current and future results.
The views and opinions expressed are not necessarily those of the broker/dealer or any affiliates. Nothing discussed or suggested should be construed as permission to supersede or circumvent any broker/dealer policies, procedures, rules, and guidelines.
Sector investments are companies engaged in business related to a specific sector. They are subject to fierce competition and their products and services may be subject to rapid obsolescence. There are additional risks associated with investing in an individual sector, including limited diversification.
Investing in small cap stocks generally involves greater risks, and therefore, may not be appropriate for every investor. The prices of small company stocks may be subject to more volatility than those of large company stocks.
International investing presents specific risks, such as currency fluctuations, differences in financial accounting standards, and potential political and economic instability. These risks are further accentuated in emerging market countries where risks can also include possible economic dependency on revenues from particular commodities or on international aid or development assistance, currency transfer restrictions, and liquidity risks related to lower trading volumes.
Definitions
Basis points (bps) are measurements used in discussions of interest rates and other percentages in finance. One basis point is equal to 1/100th of 1%, or 0.01%.
A beat is when a company’s reported earnings or other business results exceed or are better than the expectations of analysts and others who follow the company’s stock. A beat and raise refers to a company that reports earnings that exceed expectations and delivers guidance that also is better than expected.
Blended results combine actual results such as earnings or other metrics for companies that have reported earnings and estimated results for companies that have yet to report.
Beta is a measure of the volatility or systemic risk of a security, group of securities, or portfolio compared with the market as a whole.
A commodity trading advisor (CTA) is an investment professional or firm that provides client-specific advice on buying and selling futures contracts.
A consensus estimate is a forecast of a public company’s projected earnings, the results of a particular industry, sector, geography, asset class, or other category, or the expected findings of a macroeconomic report based on the combined estimates of analysts and other market observers that track the stock or data in question.
The U.S. Consumer Price Index (CPI) measures the change in prices paid by consumers for goods and services. The U.S. Bureau of Labor Statistics bases the index on prices of food, clothing, shelter, fuels, transportation, doctors’ and dentists’ services, drugs, and other goods and services that people buy for day-to-day living.
Cyclical stocks have prices influenced by macroeconomic changes in the economy and are known for following the economy as it cycles through expansion, peak, recession, and recovery.
Earnings per share (EPS) is calculated as a company’s profit divided by the outstanding shares of its common stock. The resulting number serves as an indicator of a company’s profitability.
The Empire State Manufacturing Survey is a monthly survey of manufacturers in New York State conducted by the Federal Reserve Bank of New York.
The Federal Open Market Committee (FOMC) consists of 12 members: the seven members of the Board of Governors of the Federal Reserve System; the president of the Federal Reserve Bank of New York; and four of the remaining 11 Reserve Bank presidents, who serve one-year terms on a rotating basis. The FOMC holds eight regularly scheduled meetings per year at which it reviews economic and financial conditions, determines the appropriate stance of monetary policy, and assesses the risks to its long-run goals of price stability and sustainable economic growth.
The Federal Reserve Bank of Philadelphia’s Manufacturing Business Outlook Survey is a monthly survey in which manufacturers in the Third Federal Reserve District, which includes Pennsylvania, New Jersey, and Delaware, indicate the direction of change in overall business activity and in various measures of activity at their plants: employment, working hours, new and unfilled orders, shipments, inventories, delivery times, prices paid, and prices received.
The Federal Reserve Bank of Philadelphia Nonmanufacturing Business Outlook Survey is a monthly survey of non-manufacturers in the Third Federal Reserve District, , which includes Pennsylvania, New Jersey, and Delaware. Participants indicate the direction of change in overall business activity and in the various measures of activity at their firms, including new orders, sales or revenues, employment, prices, and capital expenditures. Respondents also provide their assessments of general business conditions over the next six months.
Growth investing is a stock-buying strategy that focuses on companies expected to grow at an above-average rate compared to their industry or the market.
Hyperscalers refers to the largest cloud computing providers that can provide massive amounts of computing resources and storage at enterprise scale.
Companies that are levered to the continued buildout of data centers have earnings that directionally follow infrastructure investments made to build new data centers.
Liberation Day is a term used by President Donald Trump to refer to April 2, 2025, when he announced a wide range of unexpectedly high tariffs on many U.S. trading partners. The announcement triggered a global selloff of risk assets.
Market capitalization, or market cap, refers to the total dollar market value of a company’s outstanding shares of stock.
Melt up refers to a sudden and sustained rise in the price or investment performance of a security or larger group of securities. Melt ups can take place as investors rush not to miss out on a suddenly popular investment strategy.
A net profit margin, often shortened to net margin, measures how much net income or profit a company generates as a percentage of revenue. It can be expressed as a percentage or a decimal.
Positioning refers to assessments of whether professional investors are, on the whole, bullish or bearish on a particular security, industry, sector, market capitalization or other area of the market, as reflected by the extent to which they are invested in the area of the market in question.
The Retail Sales Report is a monthly U.S. Census Bureau report that seeks to provide current estimates of sales at retail and food services stories and inventories held by retail stores, based on a survey of about 13,000 retail businesses, supplemented by estimates for other employers.
Secular trends are large-scale and ongoing changes in economies and societies that have the potential to drive broad and lasting economic, technological, social or other kinds of changes.
Tail risk describes a form of portfolio risk associated with the increased possibility that an investment will move more than three standard deviations from the mean in a normal distribution. Left tail risks refer to unusually large losses.
Tailwind is a term used to describe events or market forces that exert a positive influence on an investment’s performance.
The University of Michigan Index of Consumer Sentiment is based on monthly telephone surveys in which at least 500 consumers in the continental United States are asked 50 questions about what they think now and what their expectations are for their personal finances, business conditions, and buying conditions. Their responses are used to calculate monthly measures of consumer sentiment that can be compared to a base value of 100 set in 1966.
Value investing is an investment strategy that involves picking stocks that appear to be trading for less than their intrinsic or book value.
Indices
The S&P 500 Index measures changes in stock market conditions based on the average performance of 500 widely held common stocks. It is a market-weighted index calculated on a total return basis with dividend reinvested. The S&P 500 represents approximately 80% of the investable U.S. equity market.
The Russell 1000® Index measures the performance of the 1,000 largest companies in the Russell 3000® Index, which represents approximately 93% of the total market capitalization of the Russell 3000® Index.
The Russell 2000® Index measures the performance of the 2,000 smallest companies in the Russell 3000® Index, which represents approximately 7% of the total market capitalization of the Russell 3000® Index.
London Stock Exchange Group plc and its group undertakings (collectively, the “LSE Group”).© LSE Group 2025. FTSE Russell is a trading name of certain of the LSE Group companies. Russell® is a trade mark of the relevant LSE Group companies and is used by any other LSE Group company under license. All rights in the FTSE Russell indexes or data vest in the relevant LSE Group company which owns the index or the data. Neither LSE Group nor its licensors accept any liability for any errors or omissions in the indexes or data and no party may rely on any indexes or data contained in this communication. No further distribution of data from the LSE Group is permitted without the relevant LSE Group company’s express written consent. The LSE Group does not promote, sponsor, or endorse the content of this communication.
M-740456 Exp. 9/12/2025
The S&P 500 Index has posted nine consecutive days in the green for the first time since November 2004.
Still, business confidence is weak and stagflationary risks remain as tariffs on goods from China begin to feed into the economy in the coming quarter.
With uncertainty running high, Matt Orton, CFA, says diversification remains essential. Areas he’s watching include European equities, companies benefiting from durable secular growth trends, and small caps.
The past month has been a wild ride.
If you had just gone to sleep at the end of March, you could be forgiven for thinking that nothing happened during April when looking at the S&P 500 Index or 10-year U.S. Treasury yields — until you looked at the dollar, volatility metrics across asset classes, or just about any sentiment barometer.1 They all point to the shocks we’ve endured and the heightened level of uncertainty going forward. The S&P 500 comes into this week on solid footing having posted nine consecutive days in the green, the first time that has occurred since November 2004.
“Last week I said the market appeared to be bottoming and that it made sense to start considering high-quality companies levered to durable growth themes that were thrown out with the bathwater,” said Matt Orton, CFA, Chief Market Strategist at Raymond James Investment Management. “I believe that continues to make sense as better than feared earnings and continued pivots from the White House have supported the bottoming process.”
That said, he added that selectivity and patience are still essential. Underlying business confidence is quite weak while stagflationary risks remain as tariffs on goods from China begin to feed into the economy over the coming quarter. There will be bumps as markets digest the degree of incoming economic weakening, but Orton is inclined to use dips opportunistically and to focus on higher-conviction ideas as he believes that the worst left-tail scenarios for the economy have been removed and that the underlying strength of the economy has been underappreciated.
“I believe diversification remains essential — across asset classes, geographies, and sectors and industries — as uncertainty remains high, but there appear to be plenty of potential opportunities for investors to consider as they seek to deploy capital and to better balance their portfolios.”
Orton believes it’s important to lay out both the bear and bull arguments for the market right now so that investors can fully appreciate and weigh the risks and opportunities.
Despite the uncertainty, the S&P 500 is back where it was before Liberation Day
S&P 500 performance since April 1
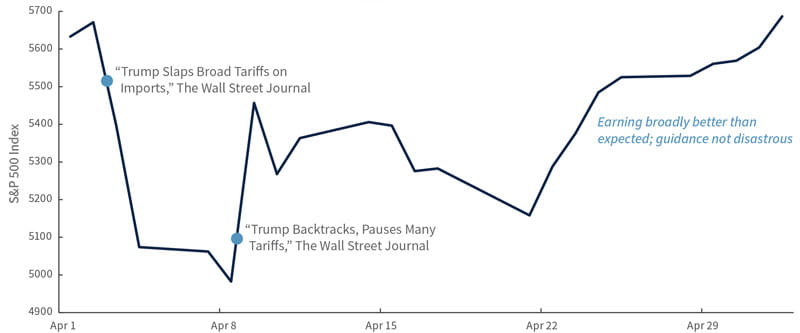
Source: Bloomberg, as of 5/2/25.
So, what are bears saying right now? For starters, the S&P 500 is back at pre-Liberation Day levels. Many bears he speaks with have argued that the rally off the lows was more a function of position capitulation than an “all clear” signal for risk. While generally mega-cap tech earnings certainly helped, positioning was quite offsides following the DeepSeek shock, so it was not surprising to see these stocks bounce. We’re still seeing earnings downgrades, and slowing growth should lead to additional price-to-earnings compressions, both of which could pressure equities after a strong move off the lows. Additionally, the longer the uncertainty and trade disruptions persist, the deeper the scarring on the economy. In particular, small businesses are essential to the relatively strong job market, but Orton said there is a lot we don’t know about how inflation could affect them and their ability to manage margins and their workforce. The U.S. Federal Reserve (Fed) also is unlikely to come to the rescue given the combination of strong data and rising inflation expectations.
And what are some of the key arguments on the bullish side?
“Critically, I don’t think the bullish argument is one that claims ‘everything is awesome,’ ” Orton said. “Rather, I think it’s one of nuance and is based on the idea that there is a reasonable path forward that avoids recession.”
That path is based on the administration listening to markets and quickly pivoting away from the most destructive “reciprocal” tariff policies announced on Liberation Day. Administration officials also are increasingly focused on issues that Orton said should have been addressed from the start. These include making the Tax Cuts and Jobs Act (TCJA) permanent and starting to lower the burden of overregulation. Progress on these issues could provide offsets to some of the damage from tariffs, he said. Capital expenditures (capex) from the hyperscalers aren’t slowing and that provides an additional ballast to the economy by offsetting delays in projects across other sectors due to elevated uncertainty.
“While earnings revisions are sending a negative signal, it’s worth noting that we’re largely seeing marginal adjustments to earnings forecasts, not the larger step-downs that many had feared,” Orton said. “Perhaps that means we’re whistling past the graveyard. Or perhaps there’s more resiliency than feared — especially if the White House starts to get trade deals signed.”
Corporate margins also remain high, he said, with the blended net profit margin for the S&P 500 currently at 12.7% – ahead of last quarter.
Following nine consecutive days of gains for the S&P 500, the market looks a bit stretched in the short term, Orton said. He expects Fed Chair Jerome Powell to strike a more hawkish tone at the press conference following this week’s meeting of the Federal Open Market Committee (FOMC). That could take some wind out of the market’s sails in the short term. Interest rate cut expectations for 2025 remain too high, in his opinion, especially given the strong base from which any economic weakening is coming. Any adjustments following the FOMC meeting could lead to some short-term volatility that he believes could present an opportunity to add to specific parts of the market.
It’s also worth paying attention to some technical dynamics across the market and in single stocks, notably leverage ratios (how much investors are borrowing) and short interest (how many investors are betting against the market), Orton said. Extreme bearishness fueled by tariffs and recession risk has driven a meaningful dispersion between gross and net leverage. Net leverage (the difference between long and short positions) has dropped while gross leverage (the total of all positions) has risen as short sellers have pressed ahead. This signals that positioning is still bearish. In this environment, Orton said even bearish investors should be on guard for an abrupt reversal. If positive news hits while too many investors are betting against stocks, a sudden rally could push prices up quickly (i.e., a short squeeze).
With these circumstances in mind, here are some areas Orton is watching now:
MAGA to MEGA. Orton believes market moves suggest a verifiable rotation out of U.S. assets into European markets. Support for U.S. assets can persist from domestic and many overseas investors insofar as we keep seeing stable hard economic data and re-emerging optimism around trade deals. But there is tangible evidence of a rotation out of U.S. assets into European markets by European investors. We’ve already seen a meaningful increase of inflows to European funds, and there is scope for that to accelerate. European investors hold nearly $9 trillion in U.S. equities — even if they rotate just 5% back into their local markets, that equates to about $450 billion, compared with the $35 billion we’ve seen moved so far year to date. European earnings have been stronger than expected, and there are some positive near-term catalysts like the German fiscal package and the ReArm Europe effort. Orton came into this year optimistic on international equities, especially European financials and defense companies. He believes there could be durability to these trades. Meanwhile, other important international markets like Japan have held up and he believes Japanese banks look interesting given attractive valuations and a supportive rate environment.
Durable secular growth themes. The artificial intelligence (AI) trade has found a lifeline over the past two weeks with strong earnings across many software companies and the hyperscalers. Capex budgets have been maintained or raised for the rest of 2025, and earnings suggest that the underlying strength of the AI-exposed segments of these companies is helping to offset weakness in more consumer/tariff-exposed parts of the business. In addition to the mega-caps and software, we’ve had strong reports from some of the AI-adjacent trades like electric equipment companies that are levered to the continued buildout of data centers. This has been a part of the market where potential buying opportunities have looked attractive, and Orton believes they still do given the damage that was done post-DeepSeek and the beats and raises from management teams. Outside of AI, he also believes other meaningful secular growth themes have provided investors with potential opportunities, including medical device companies that are supported by an aging population with more chronic diseases and high-quality companies attuned to changing consumer trends.
When will small caps work again? Smaller companies have had a tough time, suffering as post-election enthusiasm about the prospects for growth pushed up interest rates but also after Liberation Day as recession worries spiked. There has been no reason to add risk here all year, but Orton said he can’t help but feel there could be at least a tactical opportunity down the market-cap spectrum assuming things hold up after what he expects to be a more hawkish message from the FOMC. Dislocations in small caps hit new record lows with the relative performance of the Russell 2000® Index versus the Russell 1000® Index at new all-time lows dating back to 1979, while the Russell 2000 has its smallest weight ever as a percentage of the Russell 3000® Index — and that’s with a lower concentration in large caps. At its relative lows, the Russell 2000 was down nearly 30% from its last all-time high in November 2021, so clearly a lot has been priced into small caps. A steeper yield curve, a weaker dollar, and the potential for the Fed to cut interest rates later in the year give Orton some hope that if we see technical indicators hold up, there’s the potential for, at a minimum, a tactical tilt toward small caps.
The FOMC is expected to keep rates on hold. In Europe, traders are fully pricing in a quarter-point rate cut at this week’s Bank of England meeting, while Sweden’s Riksbank and Norway’s Norges Bank are both expected to hold rates steady.
On the economic front, markets get the Services ISM® Report on Business® on Monday, an update on the U.S. trade balance on Tuesday, and weekly initial jobless claims data on Thursday.
On Tuesday, U.S. Treasury Secretary Scott Bessent is due to discuss fiscal and economic policy at a House appropriations panel hearing and could shed light on trade talks with major U.S. trading partners, particularly China. On Friday, markets expect to get post-FOMC comments from Federal Reserve Bank of New York President John C. Williams, Federal Reserve Bank of Chicago President Austan Goolsbee, and Federal Reserve Board of Governors members Christopher Waller, Michael Barr, and Adriana Kugler.
1 Unless otherwise indicated, all data cited is sourced from Bloomberg as of May 2, 2025.
Risk Information:
Investing involves risk, including risk of loss.
Diversification does not ensure a profit or guarantee against loss.
Disclosures:
Index or benchmark performance presented in this document does not reflect the deduction of advisory fees, transaction charges, or other expenses, which would reduce performance. Indexes are unmanaged. It is not possible to invest directly in an index. Any investor who attempts to mimic the performance of an index would incur fees and expenses that would reduce return.
This document is a general communication being provided for informational purposes only. It is educational in nature and not designed to be taken as advice or a recommendation for any specific investment product, strategy, plan feature, or other purpose in any jurisdiction, nor is it a commitment from Raymond James Investment Management or any of its affiliates to participate in any of the transactions mentioned herein. Any examples used are generic, hypothetical, and for illustration purposes only. This material does not contain sufficient information to support an investment decision, and you should not rely on it in evaluating the merits of investing in any securities or products. In addition, users should make an independent assessment of the legal, regulatory, tax, credit, and accounting implications and make their own determinations together with their own professionals in those fields. Any forecasts, figures, opinions, or investment techniques and strategies set out are for information purposes only, based on certain assumptions and current market conditions, and are subject to change without prior notice. All information presented herein is considered to be accurate at the time of production, but no warranty of accuracy is given and no liability in respect of any error or omission is accepted. It should be noted that investment involves risks, the value of investments and the income from them may fluctuate in accordance with market conditions and taxation agreements, and investors may not get back the full amount invested. Both past performance and yields are not reliable indicators of current and future results.
The views and opinions expressed are not necessarily those of the broker/ dealer or any affiliates. Nothing discussed or suggested should be construed as permission to supersede or circumvent any broker/dealer policies, procedures, rules, and guidelines.
There are risks associated with dividend investing, including that dividend-issuing companies may choose not to pay a dividend, may not have the ability to pay, or the dividend may be less than what is anticipated. Dividend-issuing companies are subject to interest rate risk and high dividends can sometimes signal that a company is in distress. Dividends are not guaranteed and must be authorized by the company’s board of directors.
Sector investments are companies engaged in business related to a specific sector. They are subject to fierce competition and their products and services may be subject to rapid obsolescence. There are additional risks associated with investing in an individual sector, including limited diversification.
Investing in small cap stocks generally involves greater risks, and therefore, may not be appropriate for every investor. The prices of small company stocks may be subject to more volatility than those of large company stocks.
International investing presents specific risks, such as currency fluctuations, differences in financial accounting standards, and potential political and economic instability. These risks are further accentuated in emerging market countries where risks can also include possible economic dependency on revenues from particular commodities or on international aid or development assistance, currency transfer restrictions, and liquidity risks related to lower trading volumes.
Definitions
A beat is when a company’s reported earnings or other business results exceed or are better than the expectations of analysts and others who follow the company’s stock. A beat and raise refers to a company that reports earnings that exceed expectations and delivers guidance that also is better than expected.
Blended results combine actual results such as earnings or other metrics for companies that have reported earnings and estimated results for companies that have yet to report.
Capital expenditures, or capex, are monies used by a company to buy, improve, or maintain physical assets such as real estate, facilities, technology, or equipment, and may include new projects or investments.
Capitulation in finance refers to a general abandonment of an investment position by investors who sell en masse in reaction to changes in market sentiment or dynamics. The resulting marked drop in asset prices is watched as a potential end of a market decline, since those who held on to their shares during the capitulation are not expected to sell afterward.
Concentration is a term used to describe the extent to which investments in a portfolio, group of portfolios, industry, sector, index, or particular geography or clustered in groups that share specific factors or other characteristics.
Conviction represents a market participant’s confidence in particular investments or the likelihood that particular outcomes will take place. High-conviction investments represent what participants consider to be their best bets for performance for a given outlook or period.
DeepSeek is a Chinese artificial intelligence startup that in January 2025 became a leading free downloadable app in the United States. This followed DeepSeek’s announcement that its AI model performed as well as market-leading models and that it was developed at a significantly lower cost. This led to a selloff of well-known U.S. technology stocks on Jan. 27, 2025.
Earnings per share (EPS) is calculated as a company’s profit divided by the outstanding shares of its common stock. The resulting number serves as an indicator of a company’s profitability.
Earnings revision ratio refers to the ratio of analysts’ earnings upgrades to downgrades for a given group of stocks.
The Federal Open Market Committee (FOMC) consists of 12 members: the seven members of the Board of Governors of the Federal Reserve System; the president of the Federal Reserve Bank of New York; and four of the remaining 11 Reserve Bank presidents, who serve one-year terms on a rotating basis. The FOMC holds eight regularly scheduled meetings per year at which it reviews economic and financial conditions, determines the appropriate stance of monetary policy, and assesses the risks to its long-run goals of price stability and sustainable economic growth.
Fund flow is the net of all cash inflows and outflows into and out of a particular financial asset, sector, or index. It typically is measured on a quarterly or monthly basis. Investors and others look at the direction of fund flows for indications about the health of specific securities and sectors or the overall market.
Guidance refers to statements from the managers of publicly traded companies that indicate whether they expect to realize near-term profits or losses and why.
Hawkish, dovish, and centrist are terms used to describe the monetary policy preferences of central bankers and others. Hawks prioritize controlling inflation and may favor raising interest rates to reduce it or keep it in check. Doves tend to support maintaining lower interest rates, often in support of stimulating job growth and the economy more generally.
Hyperscalers refers to the largest cloud computing providers that can provide massive amounts of computing resources and storage at enterprise scale.
Initial jobless claims, reported weekly by the U.S. Department of Labor, track the number seasonally adjusted first-time claims for unemployment insurance filed by unemployed workers.
A leverage ratio in equities is a technical indicator that tracks levels of borrowing by investors. Gross leverage reflects the total of all long and short positions in the market. Net leverage reflects the difference between long and short positions.
Liberation Day is a term used by President Donald Trump to refer to April 2, 2025, when he announced a wide range of unexpectedly high tariffs on many U.S. trading partners, triggering a global selloff of risk assets.
A long position refers to the purchase of a security with the expectation that it will rise in value, reflecting a bullish attitude.
Market capitalization, or market cap, refers to the total dollar market value of a company’s outstanding shares of stock.
Mega-cap stocks are the largest publicly traded companies as measured by market capitalization. Generally, this refers to companies with market capitalizations over $200 billion.
A net profit margin, often shortened to net margin, measures how much net income or profit a company generates as a percentage of revenue. It can be expressed as a percentage or a decimal.
Positioning refers to assessments of whether professional investors are, on the whole, bullish or bearish on a particular security, industry, sector, market capitalization or other area of the market, as reflected by the extent to which they are invested in the area of the market in question.
The ReArm Europe Plan/Readiness 2030 plan includes legal and financial means to support the defense investments of member states of the European Union and to increase defense capabilities of member states quickly and significantly.
Rotation describes the movement of investments in securities from one industry, sector, factor, or asset class to another as market participants react to or try to anticipate the next stage of the economic cycle.
Secular trends are large-scale and ongoing changes in economies and societies that have the potential to drive broad and lasting economic, technological, social or other kinds of changes.
The Services ISM® Report on Business® is produced by the Institute for Supply Management (ISM) and is based on data compiled from purchasing and supply executives in a wide variety of industries nationwide. Survey responses reflect the change, if any, in the current month compared to the previous month in supplier deliveries along with seasonally adjusted business activity, new orders, and employment. // The non-manufacturing Purchasing Managers’ Index (PMI), also known as the ISM Services PMI, measures the prevailing direction of economic trends in the non-manufacturing sector. It is created by the Institute for Supply Management (ISM).
Short interest is the number of shares that have been sold short and remain outstanding. Short is a term used to describe a strategy in which investors anticipate that prices of securities will fall in the short term, so, typically, they sell securities with plans to repurchase them later at a lower price. Short interest often is seen as an indicator of current market sentiment. Rising short interest signals that investors have become more bearish. Falling short interest signals that they have become more bullish.
A short position refers to a trading technique in which an investor borrows shares, sells them, and plans to buy the shares later at a lower price.
Short sellers bet that the price of an asset will decline in value. To profit off that drop, they agree to buy shares of the asset at a predetermined price on a set expiration date. In the meantime, they borrow shares of the asset to sell at the prevailing higher price with the expectation that they will be able to buy them later at the lower price attached to the expiration date.
A short squeeze refers to what happens when the price of an asset rises sharply and forces short sellers who had bet that its price would fall to buy it instead in order to avoid incurring even greater losses. In turn, those purchases put more upward pressure on the asset price.
Stagflation, first described after the oil shocks of the 1970s, is an economic condition that includes slow economic growth (or even declines in gross domestic product), relatively high unemployment, and inflation.
Tactical trading refers to relatively short-term investing decisions made in response to expected trends or changes in the market based on fundamental and technical analysis.
Tail risk describes a form of portfolio risk associated with the increased possibility that an investment will move more than three standard deviations from the mean in a normal distribution. Left tail risks refer to unusually large losses.
Technicals refers to technical indicators of historic market data, including price and volume statistics, to which analysts apply a wide variety of mathematical formulas in their study of larger market patterns.
The U.S. trade balance, or balance of trade, refers to the difference between the values of the nation’s imports and exports for a defined period of time. It is reported weekly by the U.S. Bureau of Economic Analysis in the U.S. International Trade in Goods and Services report.
A yield curve is a line that plots yields (interest rates) of bonds having equal credit quality but differing maturity dates. The slope of the yield curve gives an idea of future interest rate changes and economic activity.
Indices
The S&P 500 Index measures changes in stock market conditions based on the average performance of 500 widely held common stocks. It is a market-weighted index calculated on a total return basis with dividend reinvested. The S&P 500 represents approximately 80% of the investable U.S. equity market.
The Russell 1000® Index measures the performance of the 1,000 largest companies in the Russell 3000® Index, which represents approximately 93% of the total market capitalization of the Russell 3000® Index.
The Russell 2000® Index measures the performance of the 2,000 smallest companies in the Russell 3000® Index, which represents approximately 7% of the total market capitalization of the Russell 3000® Index.
The Russell 3000® Index measures the performance of the 3,000 largest U.S.-traded stocks, which represent about 96% of the total market capitalization of all U.S. incorporated equity securities.
London Stock Exchange Group plc and its group undertakings (collectively, the “LSE Group”). © LSE Group 2025. FTSE Russell is a trading name of certain of the LSE Group companies. Russell® is a trade mark of the relevant LSE Group companies and is used by any other LSE Group company under license. All rights in the FTSE Russell indexes or data vest in the relevant LSE Group company which owns the index or the data. Neither LSE Group nor its licensors accept any liability for any errors or omissions in the indexes or data and no party may rely on any indexes or data contained in this communication. No further distribution of data from the LSE Group is permitted without the relevant LSE Group company’s express written consent. The LSE Group does not promote, sponsor, or endorse the content of this communication.
M-734870 Exp. 9/5/2025