“
”Markets in Focus
Timely analysis of market moves and sectors of opportunity
Despite last Friday’s selloff, the broader stock market has shown signs of resiliency grounded in hard economic data that has continued to hold up.
Markets likely will remain on edge this week and until earnings season starts.
Diversification remains a key focus for Matt Orton, CFA, whose areas to consider include dividend growth, select international equities, gold and gold miners, and some U.S. large-cap growth stocks that he says were “thrown out with the bathwater.”
A market whipsawed by headlines and economic data isn’t likely to get any relief until earnings season kicks off next week.
Notably, President Trump’s “Liberation Day” on Wednesday — when he has said that he will levy reciprocal tariffs on nations that impose duties on U.S. goods — plus the payroll report on Friday, will likely keep markets on edge.
“I believe the good news right now is that diversified portfolios seem to have held up well from a favorable correlation environment between equities and bonds as well as from resiliency across the broader stock market,” said Matt Orton, CFA, Chief Market Strategist at Raymond James Investment Management.
Despite last Friday’s selloff, 7 of 11 S&P 500 Index sectors remain positive year to date (YTD) while the broader index is down -4.8%.1 In fact, more than 60% of S&P 500 constituents have outperformed the index so far this year while 45% are positive and 33% are actually up more than 5%.
Orton said this resiliency makes sense when considering that real-time and forward-looking hard data — such as jobless claims, growth in credit card spending, tax refunds, household balance sheets, and airport traffic — have all held up reasonably well so far. International markets also continue to outperform the S&P 500 with the MSCI EAFE® (Net) Index up 9.3% YTD.
“It’s not all doom and gloom as headlines might lead you to believe, though there are very real risks that investors need to recognize,” Orton said. Diversification — across asset classes, sectors, industries, and geographies — was his key theme heading into 2025. He believes there are still opportunities to consider for investors who are thinking about better balancing their portfolios and increasing exposure to various parts of the market that have been “thrown out with the bathwater.” That said, he believes investors should think about being very tactical in the short term as uncertainty remains high amid many important macroeconomic catalysts this week.
There are pockets of outperformance
2025 year-to-date S&P 500 sector returns through 3/28/2025
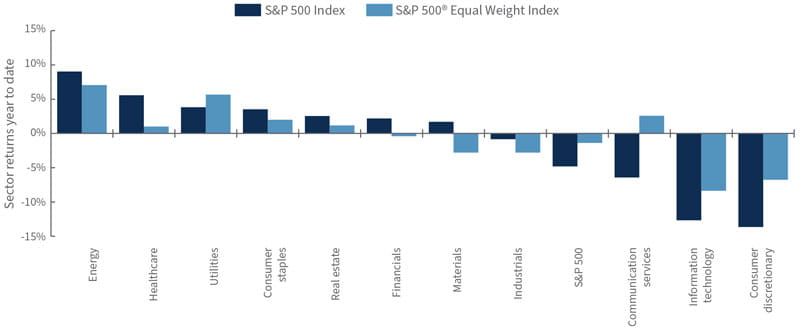
Source: Bloomberg, as of 3/28/25.
“It’s encouraging to see well-diversified investors remaining resilient as assets such as bonds and gold have provided a measure of insulation from the broader market correction,” Orton said. “The negative correlation between stocks and bonds in March highlights that we’re in an environment where fears about growth are dominating, but it will be important to monitor this relationship going forward should inflation not be as transitory as Fed Chair Jerome Powell mused at his March press conference.”
While the Consumer Price Index on March 12 indicated that a pullback in consumer demand might be enough to offset the rise in prices elsewhere, Orton said last Friday’s Personal Consumption Expenditures (PCE) Price Index didn’t really corroborate that. Rising inflation expectations are increasingly problematic as well, especially in light of erratic tariff policy, making it more difficult for the U.S. Federal Reserve (Fed) to deliver the two interest rate cuts that are still priced into the market.
“All of this speaks to my belief in considering whether to seek diversification across multiple sources and to think about remaining tactical in your approach to the market,” Orton said.
Inflation expectations sour consumer sentiment
University of Michigan Index of Consumer Sentiment data since 2020
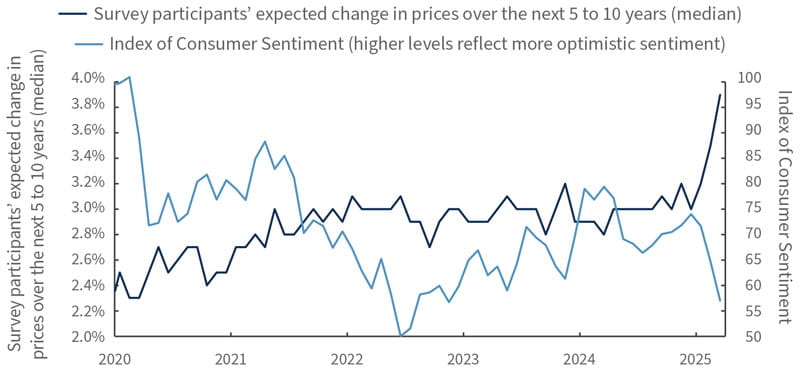
Source: Bloomberg, as of 3/28/25.
Several important catalysts this week likely will set the tone for trading until earnings season kicks off on April 11, Orton said. The first is Trump’s tariff announcements on Wednesday, which follow the 25% tariffs on autos and auto parts announced last week.
“I’ve been skeptical of relief rallies given extreme policy uncertainty, and I would fade any potential rally on April 2 as I don’t think that will be the end of announcements from Washington,” he said. He expects March nonfarm payrolls on Friday to confirm his belief that the economy is slowing, not rapidly moving into recession. But there are asymmetric downside risks to the payroll report from a market perspective: The market took solace when Powell downplayed economic weakness, so any signs of a slowdown starting to translate into hard data will not be received well.
From a more technical perspective, Orton said the market needs to start seeing some resolution to the deeply oversold conditions from earlier in March. The March U.S. Consumer Confidence Survey® showed a significant decline in market expectations — only 37.4% of respondents expected stock prices to rise over the next year, down 10% from February and over 20% from the highs in November. Usually this is a positive contrarian indicator for the market over the next 12 months, but we’re not seeing that play out yet. As long as the market can hold its March 13 low, Orton said he will feel more confident that the low has been established. However, if the market breaks down further, he said new lows are likely before the market finally washes out and moves higher. Given this backdrop, he said there are a few areas that he believes investors should consider from a diversification standpoint:
Dividend growth. Orton has advocated for thinking about increasing exposure to dividend growth in portfolios given their lower beta profile and higher quality exposure. Low volatility, size, dividend yield, and quality remain the S&P 500’s top-performing factors YTD, and Orton said dividend growers tend to straddle these pretty well. Importantly, he believes, valuations to this group of companies still look reasonable, which is important as we head into earnings season, when valuations will be heavily scrutinized given concerns over economic growth. He doesn’t believe that investors should blow out of large-cap growth to fund a massive tactical shift to dividend growth, but he suggests that perhaps an overweight to growth that has grown over the past few years could offer some marginal funding for investors considering such a position.
International exposure. International stocks have meaningfully outperformed U.S. stocks in 2025, especially those with the least dependence on U.S. revenues, likely because they are less exposed to the direct risk of tariffs and to slowing economic growth. Positive developments in Germany, potentially the rest of Europe, and China, coupled with a market regime change in the United States, could lead to longer-term shifts in capital allocation, Orton said. Many U.S. investors are more willing to consider international assets while global institutions are becoming more mindful of their U.S. exposure. Such shifts could support better performance of international equities going forward, he said. However, at this point Orton said he would wait for downside opportunities to consider exploring this area given that Eurozone equities have already had a strong run and that it will take time for the positive impact of European fiscal policy and improving growth to feed into earnings and improving margins. Orton said Japan also remains interesting.
The market basically has moved sideways since recovering from last summer’s massive unwinding of the yen carry trade, but earnings revisions there are the most positive across developed markets and Orton believes there is scope for a structural uplift to return on equity through higher corporate leverage.
Gold and gold miners. Gold has continued to move higher this year, providing another way for investors to consider for diversifying their portfolios. Gold has historically provided downside risk mitigation to portfolios in traditional risk-off scenarios when stocks and rates fall together as growth and earnings expectations are marked down. That has only recently been the case, but gold was strong well before the most recent growth scare. Gold has found support from investors looking to diversify portfolios, but Orton noted that more importantly there has been a meaningful pickup in buying by central banks. If uncertainty about U.S. growth persists and hard data holds up, Orton thinks gold can continue to work well.
Are investors too pessimistic on the mega-caps? Large-cap growth hasn’t been the place to be this year as the Magnificent Seven has become more like the Maleficent Seven. This group is down 15% YTD and more than 20% since its high in December. However, Orton said he believes “the baby has been thrown out with the bathwater” in some cases, and consequently investors could have an opportunity to get exposure to some of these businesses at a reasonable valuation. The volatility around the growth complex has been largely due to repositioning of portfolios and significant de-grossing rather than weak fundamentals, though Orton said some companies have deservedly had their multiples slashed. Many of these companies have strong secular growth tailwinds along with robust balance sheets and significant cash on hand to weather the current macro environment. Orton said he would tread carefully in the near term given the instability of the market, but he believes the general level of multiple compression sets some companies up well heading into earnings season.
In addition to Trump’s tariff announcements, watch for the nonfarm payroll report and the ADP® National Employment Report™. Powell is scheduled to speak Thursday about the economic outlook.
In Europe, consumer price data from Italy, Germany and the wider euro-region are due, while European Central Bank President Christine Lagarde is set to appear at the bank’s conference on artificial intelligence.
In Asia, the Reserve Bank of Australia is expected to keep rates on hold at its policy meeting while China’s Caixin Purchasing Management Index reports are due.
1 Unless otherwise indicated, all data cited is sourced from Bloomberg as of Mar. 28, 2025.
Risk Information:
Investing involves risk, including risk of loss.
Diversification does not ensure a profit or guarantee against loss.
Disclosures:
Index or benchmark performance presented in this document does not reflect the deduction of advisory fees, transaction charges, or other expenses, which would reduce performance. Indexes are unmanaged. It is not possible to invest directly in an index. Any investor who attempts to mimic the performance of an index would incur fees and expenses that would reduce return.
This document is a general communication being provided for informational purposes only. It is educational in nature and not designed to be taken as advice or a recommendation for any specific investment product, strategy, plan feature, or other purpose in any jurisdiction, nor is it a commitment from Raymond James Investment Management or any of its affiliates to participate in any of the transactions mentioned herein. Any examples used are generic, hypothetical, and for illustration purposes only. This material does not contain sufficient information to support an investment decision, and you should not rely on it in evaluating the merits of investing in any securities or products. In addition, users should make an independent assessment of the legal, regulatory, tax, credit, and accounting implications and make their own determinations together with their own professionals in those fields. Any forecasts, figures, opinions, or investment techniques and strategies set out are for information purposes only, based on certain assumptions and current market conditions, and are subject to change without prior notice. All information presented herein is considered to be accurate at the time of production, but no warranty of accuracy is given and no liability in respect of any error or omission is accepted. It should be noted that investment involves risks, the value of investments and the income from them may fluctuate in accordance with market conditions and taxation agreements, and investors may not get back the full amount invested. Both past performance and yields are not reliable indicators of current and future results.
The views and opinions expressed are not necessarily those of the broker/dealer or any affiliates. Nothing discussed or suggested should be construed as permission to supersede or circumvent any broker/dealer policies, procedures, rules, and guidelines.
There are risks associated with dividend investing, including that dividend-issuing companies may choose not to pay a dividend, may not have the ability to pay, or the dividend may be less than what is anticipated. Dividend-issuing companies are subject to interest rate risk and high dividends can sometimes signal that a company is in distress. Dividends are not guaranteed and must be authorized by the company’s board of directors.
Sector investments are companies engaged in business related to a specific sector. They are subject to fierce competition and their products and services may be subject to rapid obsolescence. There are additional risks associated with investing in an individual sector, including limited diversification.
Investing in Large Caps is based on the expectation of positive price performance due to continued earnings growth or anticipated changes in the market or within the company itself. However, if a company fails to meet that expectation or anticipated changes do not occur, its stock price may decline. Moreover, as with all equity investing, there is the risk that an unexpected change in the market or within the company itself may have an adverse effect on its stock.
International investing presents specific risks, such as currency fluctuations, differences in financial accounting standards, and potential political and economic instability. These risks are further accentuated in emerging market countries where risks can also include possible economic dependency on revenues from particular commodities or on international aid or development assistance, currency transfer restrictions, and liquidity risks related to lower trading volumes.
Investing in commodities is generally considered speculative because of the significant potential for investment loss. Their markets are likely to be volatile and there may be sharp price fluctuations even during periods when prices overall are rising. Gold is subject to the special risks associated with investing in precious metals, including but not limited to: price may be subject to wide fluctuation; the market is relatively limited; the sources are concentrated in countries that have the potential for instability; and the market is unregulated.
Definitions
The ADP® National Employment Report™ is published monthly by the ADP Research Institute® in close collaboration with Moody’s Analytics. The ADP® National Employment Report™ provides a monthly snapshot of U.S. nonfarm private sector Employment based on actual transactional data.
Asymmetric risk describes a risk posed when the gain (or loss) that could result from the movement of an underlying asset or metric in one direction is significantly different from the loss (or gain) that would take place from a move in the other direction.
Beta is a measure of the volatility or systemic risk of a security, group of securities, or portfolio compared with another security, group of securities, portfolio, or the market as a whole.
A carry trade involves borrowing money in countries where interest rates are low and using the funds to make investments in countries with high interest rates. An unwinding in a carry trade refers to the rush that takes place when many investors leave trade all at once.
The Caixin China General Manufacturing Purchasing Managers Index (PMI), compiled by IHS Markit, tracks supply and demand, manufacturing production, output, new orders, employment, and other measures of economic activity in China’s manufacturing sector.
The Caixin China General Services PMI, compiled by IHS Markit, tracks sales, employment, inventories, and prices in China’s services industry. It is based on data compiled from monthly replies to questionnaires sent to purchasing executives in more than 400 companies. Survey responses reflect the change, if any, in the current month compared to the previous month based on data collected mid-month. A reading above 50 indicates expansion, while anything below that points to contraction.
The U.S. Consumer Confidence Survey®, published monthly by The Conference Board, reflects prevailing business conditions and likely developments for coming months based on consumer attitudes, buying intentions, vacation plans, and expectations for inflation, stock prices, and interest rates.
The Consumer Price Index (CPI) measures the change in prices paid by consumers for goods and services. The U.S. Bureau of Labor Statistics bases the index on prices of food, clothing, shelter, fuels, transportation, doctors’ and dentists’ services, drugs, and other goods and services that people buy for day-to-day living. Prices are collected each month in 75 urban areas across the country from about 6,000 households and 22,000 retailers.
A correction is a decline in the market price of a security or index of more than 10% from its recent highs but not more than 20%.
Correlation is a statistic that measures the degree to which two securities or variables move in relation to each other. Negative correlation, also known as inverse correlation, tracks the movement of two variables that tend to move in opposite directions, so that when one rises, the other falls.
De-grossing occurs when investors rapidly reduce their long and short positions in companies, which can be triggered by perceived market risks or shifts in strategy. This may lead to market volatility and increased correlations.
Dividend payers are the companies that distribute a portion of their profits to shareholders in the form of a dividend.
Dividend yield, which is expressed as a percentage, is a ratio of the current rate of dividend payout divided by the current stock price.
Factor investing is an approach to investing that selects securities based on characteristics associated with higher returns. These characteristics, or factors, can be macroeconomic factors or style factors. Macroeconomic factors are focused on broad risks across asset classes and include the rate of inflation: growth in gross domestic product; and the unemployment rate. Style factors include differences in growth versus value stocks; market capitalization, and industry sector. Factor performance refers to a focus on performance of securities within a particular factor or between groups of different kinds of factors.
Fade describes an investment strategy of trading against a prevailing trend in the market.
Fiscal policy refers to the tax collection and spending a government uses to influence its country’s economy.
Growth investing is a stock-buying strategy that focuses on companies expected to grow at an above-average rate compared to their industry or the market.
Liberation Day is a term used by President Donald Trump to refer to April 2, 2025, when he has said that he will announce reciprocal tariffs on nations that levy duties on U.S. goods.
The Magnificent Seven refers to the seven largest stocks by market capitalization in the S&P 500 Index, as of Dec. 31, 2024. Collectively they made up more than 25% of the market capitalization of the entire index. They are Alphabet, Amazon.com, Apple, Meta Platforms, Microsoft, NVIDIA and Tesla.
Market capitalization, or market cap, refers to the total dollar market value of a company’s outstanding shares of stock.
A multiple, sometimes referred to as the price multiple or earnings multiple, is a measure of a company’s value based on the ratio of its current share price to its earnings per share. This ratio is known as the price-to-earnings ratio, or P/E.
Multiple compression is an effect that takes place when a company’s earnings rise, but its stock price does not move in response. This decreases the company’s financial multiple, and this often reflects a change in investor expectations. In the case of a company that posts flat earnings, a multiple compression could see the stock price fall or, in the event that the company reports falling earnings, the stock price could fall faster than the earnings.
Oversold is a term used to describe a security or group of securities believed to be trading at a level below its or their intrinsic or fair value.
Overweight describes a portfolio position in an industry sector or some other category that is greater than the corresponding weight level in a benchmark portfolio.
The payroll report, officially known as the Employment Situation Summary, is a monthly U.S. Bureau of Labor Statistics (BLS) report tracking nonfarm payroll employment and the national unemployment rate, with data on changes in average hourly earnings, and job trends in public and private sectors of employment. The report is based on surveys of households and employers.
The Personal Consumption Expenditures (PCE) Price Index is a measure of the prices that people living in the United States, or those buying on their behalf, pay for goods and services. The PCE price index, released monthly by the U.S. Department of Commerce Bureau of Economic Analysis, is known for capturing inflation or deflation across a wide range of consumer expenses and reflecting changes in consumer behavior.
Positioning refers to assessments of whether professional investors are, on the whole, bullish or bearish on a particular security, industry, sector, market capitalization or other area of the market, as reflected by the extent to which they are invested in the area of the market in question.
A relief rally is a break from a wider selloff in a market that sees a temporary increase in security prices. Relief rallies can be triggered by news or data that turns out to be better than expected or first believed.
Return on equity (ROE) is a measure of financial performance calculated by dividing net income by shareholders’ equity.
A risk-off scenario is typically one where sentiment is driven by a weakening growth environment, bad news that fuels a bearish outlook, and/or investor expectations of unfavorable risk/reward ratios.
Secular trends are large-scale and ongoing changes in economies and societies that have the potential to drive broad and lasting economic, technological, social or other kinds of changes.
Tailwind is a term used to describe events or market forces that exert a positive influence on an investment’s performance
Technicals refers to technical indicators of historic market data, including price and volume statistics, to which analysts apply a wide variety of mathematical formulas in their study of larger market patterns.
The University of Michigan Index of Consumer Sentiment is based on monthly telephone surveys in which at least 500 consumers in the continental United States are asked 50 questions about what they think now and what their expectations are for their personal finances, business conditions, and buying conditions. Their responses are used to calculate monthly measures of consumer sentiment that can be compared to a base value of 100 set in 1966.
Volatility investing is a strategy that seeks to take advantage of sudden changes in the price of assets in markets where prices are changing rapidly, erratically, or by large degrees when compared with their historical averages. Investments in securities with volatile prices can carry both high potential rewards and high risk.
Washed out is a term used in finance to describe a state where market sentiment displays no clear trend or enthusiasm for particular areas of the market.
Indices
The S&P 500 Index measures changes in stock market conditions based on the average performance of 500 widely held common stocks. It is a market-weighted index calculated on a total return basis with dividend reinvested. The S&P 500 represents approximately 80% of the investable U.S. equity market.
The S&P 500® Equal Weight Index (EWI) includes the same constituents as the capitalization-weighted S&P 500 Index, but each company in the S&P 500 EWI is allocated a fixed weight.
The MSCI EAFE® (Net) Index measures the performance of performance of large and mid-cap securities across 21 developed markets, including countries in Europe, Australasia and the Far East, excluding the U.S. and Canada. The MSCI EAFE® (Net) Index subtracts any foreign taxes applicable to US citizens but not applicable to citizens in the overseas country.
M-712758 Exp. 7/31/2025
Many parts of the market appear to have priced in the possibility of recession and look poised for a bounce, but tariff effects still have the potential to be worse than investors are expecting.
Investors should be prepared for more whiplash from changing market narratives.
Once earnings season begins, markets could see more conclusive trends from management guidance on consumers, sentiment, and earnings for the rest of the year.
After four consecutive weeks of losses, the S&P 500 Index finally ended last week in positive territory.1 Now the question is which direction markets will move in next.
“Last week provided a nice check on recent pessimism: Investors were reminded that the economy isn’t rapidly falling off a cliff,” said Matt Orton, CFA, Chief Market Strategist at Raymond James Investment Management. “Investor sentiment seems to have temporarily bottomed near the lowest level on record, but there hasn’t been a V-shaped bounce, which is typical of capitulation.”
Orton said that there is still a significant amount of uncertainty — especially with reciprocal tariff announcements coming on April 2 — making it difficult to see the light at the end of the tunnel. “We’re stuck in this macro-driven market environment until earnings season kicks off, which means investors should be prepared for more whiplash from changing market narratives until the second week of April,” he said.
“The good news is that many parts of the market are already pricing in higher probabilities of recession and look poised for a bounce; the bad news is that April 2 still has the potential to be worse than investors are expecting,” Orton said. Markets could see another knee-jerk drop before investors finally pick up the pieces at sustainable levels. The high level of uncertainty is why Orton has strongly advocated for investors to consider better diversifying their portfolios across asset classes, sectors/industries, and geographies.
“I wouldn’t be chasing the bounce right now, given the risks coming up in early April, but there is actually a lot that is working well for balanced, well-diversified portfolios in 2025,” Orton said.
Investors have heard for weeks that the United States will begin its rollout of reciprocal tariffs on April 2. “What we’re likely to see is a series of tariffs on perceived ‘villains’ and tariffs on industries layered on top of already-existing country tariffs,” Orton said. Effective tariff levels on industries in some countries could exceed 25%, at least at the outset. “There are likely to be exemptions and revisions after negotiations, but I don’t think the market is appropriately prepared for what could be announced.”
S&P 500 Index posts first weekly gain in five weeks, since the correction began
S&P 500 Index weekly gains since the beginning of 2024
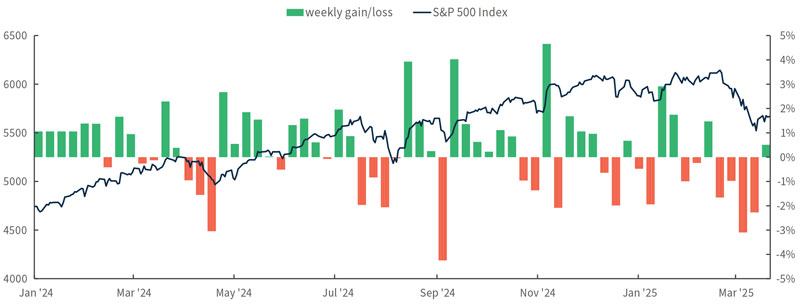
Source: Bloomberg, as of 3/21/25.
“That said, I also think that any further drawdown based on tariff news could finally be the point at which investors can start exploring opportunities for diversification,” Orton added. “Any hyperbolic reaction to impending recession should be faded.”
Once earnings season begins, Orton expects to see more conclusive trends from management guidance on consumers, sentiment, and where earnings are likely to remain robust for the rest of 2025 and into 2026. He said that there are likely to be some bumps in the very short term, but he thinks the long-term picture looks optimistic.
Hard economic data, such as retail sales, industrial production, and housing starts all held up last week. The U.S. Federal Reserve (Fed) also provided reasons for optimism with its assessment of recession possibilities, but a number of conflicting messages beneath the surface highlight potential risks to the economy. At the same time, the most recent Bank of America Merrill Lynch Fund Manager Survey showed the second biggest drop in global growth expectations and the biggest drop in allocations to U.S. equities ever recorded.
“I take survey data with a healthy grain of salt, but it does provide an important signal with respect to where investors are looking for opportunities,” Orton said. “Additionally, it signals the extreme environment in which we’re operating.” He warned against chasing upside right when some of the winning trades might be ready to take a breather, but here’s what’s on his mind right now:
Dividend growth for diversification. Orton said that dividend growers were forgotten when growth and momentum dominated the market, but investors seem to have flocked to these companies more recently. He noted that dividend-growing companies generally have better balance sheets, diversified businesses, and cash flow that is designed to sustain their dividend growth. “Low volatility, size, dividend yield, and quality have been the top-performing year-to-date factors, and these companies tend to straddle them pretty well,” Orton said.
Balancing growth and value. Eight of the eleven sectors in the S&P 500 Index have positive year-to-date returns. Unfortunately, the ones that matter most from the perspective of weighting and sentiment — information technology and communication services — are the ones that are down the most. Orton believes that it’s largely a function of mega-cap malaise rather than persistent problems through each sector. “It makes sense that this cohort would see some consolidation after years of rapid gains,” Orton said. Earnings growth for the broader market is also set to finally eclipse that of the Magnificent Seven companies later in 2025, which is why Orton continues to favor the S&P 500® Equal Weight Index over its capitalization-weighted counterpart, the S&P 500 Index.
“Part of this dynamic has led value to meaningfully outperform growth,” Orton said. “There is a case to be made for value to remain strong, but I don’t think this is the time to abandon growth for value.” Instead, Orton believes that investors should seek better balanced performance between the two style boxes, looking for opportunities to consider if markets throw the baby out with the bathwater.
Positioning around MEGA vs. MAGA. U.S. President Donald Trump’s mission to Make America Great Again (MAGA) has inspired efforts to Make Europe Great Again (MEGA). Germany recently approved a spending plan of up to 1 trillion euro that will include investments in defense, infrastructure (including digital infrastructure), and energy companies. There is also scope for a European Capital Markets Union that could support 470 billion euro per year in additional bank lending for regional investments. These developments help explain why the EURO STOXX 50 index has outperformed the S&P 500 Index by 22% over the past 13 weeks, which is only the third time this has happened over the last 35 years.
“Clearly, market prices reflect this enthusiasm, and we’re going to get a reality check in the next few weeks as earnings start and more details actually get released around these plans,” Orton said. He thinks Eurozone equity outperformance is probably due to take a break. “I would be careful about chasing the trade in the short term. There are plenty of investment opportunities in markets like Japan, which has the strongest earnings momentum across developed markets right now,” he said.
Key economic and inflation data will be released this week, including S&P Global Flash PMI™ (Purchasing Managers’ Index) reports for several of the world’s largest economies on Monday. U.S. data releases through the rest of the week include the U.S. Consumer Confidence Survey® on Tuesday and the U.S. Census Bureau’s report on U.S. Durable Goods Orders on Wednesday. The week’s highlights will be on Friday, with the Personal Consumption Expenditures (PCE) Price Index and core PCE, the Personal Consumption Expenditures (PCE), excluding Food and Energy, Price Index.
Now that the Fed’s communications blackout period is over, its officials can clarify the notion of “transitory” inflation that was reintroduced last week. Currently, seven Fed officials are scheduled to speak, although the most market-relevant appearances are probably Raphael Bostic, President of the Federal Reserve Bank of Atlanta, appearing on Bloomberg TV on Monday and Alberto Musalem, President of the Federal Reserve Bank of St. Louis, delivering a speech on Wednesday.
1 Unless otherwise indicated, all data cited is sourced from FactSet as of Mar. 21, 2025.
Risk Information:
Investing involves risk, including risk of loss.
Diversification does not ensure a profit or guarantee against loss.
Disclosures:
Index or benchmark performance presented in this document does not reflect the deduction of advisory fees, transaction charges, or other expenses, which would reduce performance. Indexes are unmanaged. It is not possible to invest directly in an index. Any investor who attempts to mimic the performance of an index would incur fees and expenses that would reduce return.
This document is a general communication being provided for informational purposes only. It is educational in nature and not designed to be taken as advice or a recommendation for any specific investment product, strategy, plan feature, or other purpose in any jurisdiction, nor is it a commitment from Raymond James Investment Management or any of its affiliates to participate in any of the transactions mentioned herein. Any examples used are generic, hypothetical, and for illustration purposes only. This material does not contain sufficient information to support an investment decision, and you should not rely on it in evaluating the merits of investing in any securities or products. In addition, users should make an independent assessment of the legal, regulatory, tax, credit, and accounting implications and make their own determinations together with their own professionals in those fields. Any forecasts, figures, opinions, or investment techniques and strategies set out are for information purposes only, based on certain assumptions and current market conditions, and are subject to change without prior notice. All information presented herein is considered to be accurate at the time of production, but no warranty of accuracy is given and no liability in respect of any error or omission is accepted. It should be noted that investment involves risks, the value of investments and the income from them may fluctuate in accordance with market conditions and taxation agreements, and investors may not get back the full amount invested. Both past performance and yields are not reliable indicators of current and future results.
The views and opinions expressed are not necessarily those of the broker/dealer or any affiliates. Nothing discussed or suggested should be construed as permission to supersede or circumvent any broker/dealer policies, procedures, rules, and guidelines.
There are risks associated with dividend investing, including that dividend-issuing companies may choose not to pay a dividend, may not have the ability to pay, or the dividend may be less than what is anticipated. Dividend-issuing companies are subject to interest rate risk and high dividends can sometimes signal that a company is in distress. Dividends are not guaranteed and must be authorized by the company’s board of directors.
Sector investments are companies engaged in business related to a specific sector. They are subject to fierce competition and their products and services may be subject to rapid obsolescence. There are additional risks associated with investing in an individual sector, including limited diversification.
International investing presents specific risks, such as currency fluctuations, differences in financial accounting standards, and potential political and economic instability. These risks are further accentuated in emerging market countries where risks can also include possible economic dependency on revenues from particular commodities or on international aid or development assistance, currency transfer restrictions, and liquidity risks related to lower trading volumes.
Definitions
The Bank of America Merrill Lynch Fund Manager Survey is a monthly canvass of the views of about 200 mutual and hedge fund managers around the world.
Capitulation is a dramatic surge of selling pressure in declining markets, usually signaled by high trading volume and sharp declines in price. It typically involves risk-averse investors selling their securities, followed by a rebound in prices as more risk-tolerant investors replace them.
U.S. Census Bureau’s report on U.S. Durable Goods Orders is compiled from the U.S. Census Bureau’s Manufacturers’ Shipments, Inventories, and Orders (M3) survey, which is a voluntary survey that provides statistics on a calendar-month basis for manufacturers’ value of shipments, new orders (net of cancellations), end-of-month order backlog (unfilled orders), end-of-month total inventory (at current cost or market value), and inventories by stage of fabrication (materials and supplies, work-in-process, and finished goods).
The U.S. Consumer Confidence Survey®, published monthly by The Conference Board, reflects prevailing business conditions and likely developments for coming months based on consumer attitudes, buying intentions, vacation plans, and expectations for inflation, stock prices, and interest rates.
Core PCE, officially known as the Personal Consumption Expenditures (PCE), excluding Food and Energy, Price Index, is a measure of the prices that U.S. consumers pay for goods and services, not including two categories – food and energy – where prices tend to swing up and down more dramatically and more often than other prices. The core PCE price index, released monthly by the U.S. Department of Commerce Bureau of Economic Analysis, measures inflation trends and is watched closely by the U.S. Federal Reserve as it conducts monetary policy.
A drawdown is a decline in the returns of a security or group of securities, as measured over a period from the peak of returns to their trough.
Fade describes an investment strategy of trading against a prevailing trend in the market.
S&P Global Flash PMI™ (Purchasing Managers’ Index) reports are produced for various countries by by S&P Global and are based on original survey data collected from companies based in the manufacturing and service sectors. The flash estimates is based on around 85% of total PMI survey responses each month and are designed to provide an accurate advance indication of the final PMI data.
The Federal Open Market Committee (FOMC) consists of 12 members: the seven members of the Board of Governors of the Federal Reserve System; the president of the Federal Reserve Bank of New York; and four of the remaining 11 Reserve Bank presidents, who serve one-year terms on a rotating basis. The FOMC holds eight regularly scheduled meetings per year at which it reviews economic and financial conditions, determines the appropriate stance of monetary policy, and assesses the risks to its long-run goals of price stability and sustainable economic growth. The FOMC observes a blackout period, which begins at midnight of the second Saturday before each meeting. During the blackout periods, committee members do not make public comments about macroeconomic developments or monetary policy issues.
Growth investing is a stock-buying strategy that focuses on companies expected to grow at an above-average rate compared to their industry or the market.
Guidance refers statements from the managers of publicly traded companies that indicate whether they expect to realize near-term profits or losses and why.
The Magnificent Seven refers to the seven largest stocks by market capitalization in the S&P 500 Index, as of Dec. 31, 2024. Collectively they made up more than 25% of the market capitalization of the entire index. They are Alphabet, Amazon.com, Apple, Meta Platforms, Microsoft, NVIDIA and Tesla.
Market capitalization, or market cap, refers to the total dollar market value of a company’s outstanding shares of stock.
Mega-cap stocks are the largest publicly traded companies as measured by market capitalization. Generally, this refers to companies with market capitalizations over $200 billion.
Momentum investing is a strategy that aims to capitalize on the continuance of an existing market trend. It is a trading strategy in which investors buy securities that are already rising and look to sell them when they look to have peaked. It entails taking long positions on financial instruments with prices trending up and short positions on instruments with prices trending down.
The Personal Consumption Expenditures (PCE) Price Index is a measure of the prices that people living in the United States, or those buying on their behalf, pay for goods and services. The PCE price index, released monthly by the U.S. Department of Commerce Bureau of Economic Analysis, is known for capturing inflation or deflation across a wide range of consumer expenses and reflecting changes in consumer behavior.
Positioning refers to assessments of whether professional investors are, on the whole, bullish or bearish on a particular security, industry, sector, market capitalization or other area of the market, as reflected by the extent to which they are invested in the area of the market in question.
Style boxes are used to group different equity investments by their key characteristics. This can include market capitalization and investment style, showing where specific investments or strategies fit into the overall market.
A “V-shaped bounce” occurs when prices drop rapidly and then recover, which looks like the letter “V” on a chart of prices over time.
Indices
The S&P 500 Index measures changes in stock market conditions based on the average performance of 500 widely held common stocks. It is a market-weighted index calculated on a total return basis with dividend reinvested. The S&P 500 represents approximately 80% of the investable U.S. equity market.
The S&P 500® Equal Weight Index (EWI) includes the same constituents as the capitalization-weighted S&P 500 Index, but each company in the S&P 500 EWI is allocated a fixed weight.
The EURO STOXX 50 index is a blue-chip index designed to represent the 50 largest companies in the Eurozone.
M-709674 Exp. 7/24/2025
High levels of policy uncertainty, slowing economic data, and depressed investor sentiment combined to create one of the swiftest market drops in the past seven decades.
Corrections can provide a reset to stretched positioning, sentiment, and extended expectations without portending deeper cracks in the economy or markets.
Although Chief Market Strategist Matt Orton, CFA, remains optimistic on the market and skeptical of the recession narrative, caution is still warranted in the near term.
Last week, the S&P 500 Index officially entered a correction — defined as a drop of 10%-20% from its 52-week high.1
“Corrections are uncomfortable, but they are inevitable,” said Matt Orton, CFA, Chief Market Strategist at Raymond James Investment Management. “This drop has felt particularly awful, because high levels of policy uncertainty and evidence of slowing economic data mixed with already depressed investor sentiment to create the swiftest 10% drop in the past seven decades.”
Prominent tech companies have unwound even more spectacularly, with all of the Magnificent Seven companies in, or flirting with, a bear market. The Russell 2000® Index, a measure of small-cap companies, is down nearly 20% from its post-election highs, consistent with recessionary conditions. What’s going on here, and should investors be concerned?
“At a broad level, the post-election euphoria is being unwound as reality sets in,” Orton said. The economy was already slowing from a long run of above-trend growth. “At the same time, we’re seeing the policy priorities of the new administration and the difficult tradeoffs that must be made in real time,” he said.
Tariffs have caused a spike in uncertainty for investors and businesses while Department of Government Efficiency (DOGE) cuts are happening at a dizzying pace, increasing the risks that something breaks. Orton said that this is weighing on consumers broadly, leading earnings estimates and growth projections to come down, which in turn has led to investors selling first and asking questions later.
“While there are legitimate concerns, I do think that the market has overreacted,” Orton said. “Corrections are quite common and often provide a reset to stretched positioning, sentiment, and extended expectations.” He added that they do not always portend deeper cracks in the economy or markets that ultimately lead to recessions and sharper declines.
Orton said that this is also consistent with historical data. On average, corrections occur every few years, and over the past 75 years, only one third of S&P 500 Index corrections actually turned into a bear market.
“The relief rally on Friday was encouraging, showing that there is still a bid to the market at a certain level, and there have been pockets of relative strength,” Orton said. But first quarter earnings season is still weeks away, and he expects that the market will continue to be dominated by volatile macroeconomic data until then. “I remain optimistic on the market and skeptical of the recession narrative, but caution is still warranted in the near term,” he said. “Investors should have their shopping lists ready to consider taking advantage of some attractive opportunities that could be created in this correction.”
A 10% drawdown is well short of unusual
S&P 500 Index maximum intra-year drawdowns, last 50 days
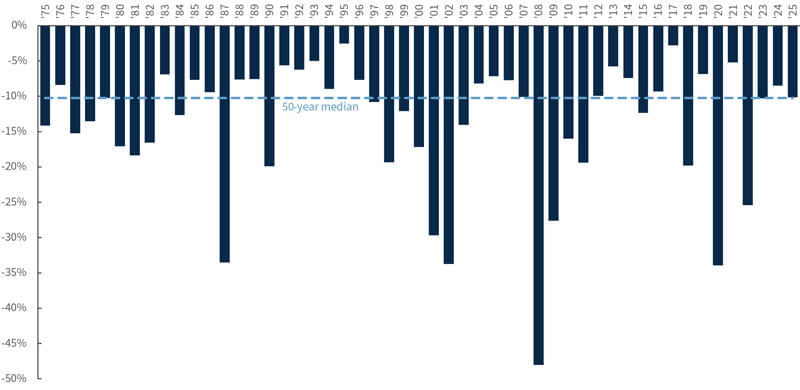
Source: Bloomberg, as of 3/14/25.
Friday’s relief rally could continue this week, but near-term concerns may keep volatility elevated. “I don’t put too much stock in survey data, especially when related to sentiment, but the March University of Michigan Consumer Sentiment data is worth noting,” Orton said. “The plunge in consumer sentiment, paired with the surge in inflation expectations, certainly indicates that consumer concerns — across political identification — are growing over the impact of the Trump administration’s policies.”
Orton said that the decline in sentiment is another plot point in the recession story, which has gained traction after a number of CEOs talked down near-term growth expectations. “Ultimately, markets stop panicking when policy makers start panicking, and I believe that either the Trump administration or U.S. Federal Reserve Chair Jerome Powell will blink if we continue to see weak growth data,” Orton said. Until that point, he recommends being tactical.
Orton’s key theme heading into 2025 was to Make Diversification Great Again, which includes better diversifying portfolios across asset classes, geographies, and sectors/industries. Here’s what’s on his radar right now:
Positioning for a continued European recovery. The rally in Europe could be a bit overextended, but Orton said there is still scope for flows to accelerate if markets see follow through on the better than expected fourth-quarter earnings and increased guidance. “Europe is not immune from slower U.S. economic growth or the next round of reciprocal tariffs that are coming on April 2, but there is a put from the European Central Bank on the monetary side,” he said. Weak demand has been a longstanding problem for Europe, but massive fiscal stimulus offers a potential solution.
Orton said that ReArm Europe is a “whatever it takes” moment, and reform of Germany’s debt brake and the announcement of a 500 billion Euro infrastructure fund could provide additional footing. However, these measures will not deliver economic growth overnight, and he warned that the market might be a bit ahead of itself. Right now, Orton remains optimistic around European banks and defense companies, and he would consider looking for opportunities amid pullbacks. He finds it encouraging that financial institutions have been driving the recent upside and German fiscal policy has provided tailwinds.
Lean into the U.S. market rotation. Orton prefers to consider opportunities in large banks, select mega-caps, and healthcare. Most large-cap banks have given back all of their post-election performance, and in his view, this is too pessimistic given the level of earnings growth that has been delivered, especially if concerns around economic growth are overdone. While loan growth has been slowing, Orton said that there are still drivers that could compel earnings per share (EPS) growth to follow through in 2025. He also continues to like gold mining companies, noting that industrial miners could be an interesting play given the improvement in China and a lack of participation in the European rally. Finally, healthcare has been a top-performing sector year to date; Orton said that many of the pharmaceutical names that had been left for dead over the past two years aren’t as bad as feared. Cash balances are strong, companies are seeing replenished pipelines, and healthcare is the only sector where EPS is expected to accelerate higher from the fourth quarter of 2024 to the first quarter of 2025. “I think healthcare valuations still look favorable, and its defensive characteristics provide a good place to consider waiting through the market volatility,” Orton said.
Reconsidering some of the Magnificent Seven. “With respect to the mega-caps, the baby was thrown out with the bathwater around the artificial intelligence (AI) trade,” Orton said. He thinks the continued volatility in technology has largely been due to portfolio repositioning and significant de-grossing rather than weak fundamentals. “Some of these companies are the most favorably priced they have been since their lows in 2022, with strong underlying businesses and rock solid balance sheets,” he said.
Dividend growth, anyone? The average S&P 500 Index constituent has meaningfully outperformed its index average in 2025. Rotation has continued beneath the surface, and the year-to-date return of the S&P 500® Equal Weight Index is -1.77%, compared to its capitalization-weighted counterpart’s return of -4.13%. Dividend growers have been positive in 2025, providing some insulation from market volatility. As U.S. growth scares remain on investors’ minds, Orton said that dividend growth can provide ballast to portfolios at the intersection of growth and value.
The U.S. Federal Reserve will top a busy week of global central bank interest-rate decisions by releasing a new dot plot. The Fed is expected to hold rates steady on Wednesday, and the Bank of England is expected to leave rates unchanged on Thursday while leaving its guidance in place. Later in the week, the Bank of Japan is also expected to keep rates unchanged.
U.S. economic data releases this week include retail sales on Monday, housing starts on Tuesday, and regional manufacturing surveys from the Federal Reserve Bank of New York on Monday and the Federal Reserve Bank of Philadelphia on Thursday.
1 Unless otherwise indicated, all data cited is sourced from FactSet as of Mar. 14, 2025.
Risk Information:
Investing involves risk, including risk of loss.
Diversification does not ensure a profit or guarantee against loss.
Disclosures:
Index or benchmark performance presented in this document does not reflect the deduction of advisory fees, transaction charges, or other expenses, which would reduce performance. Indexes are unmanaged. It is not possible to invest directly in an index. Any investor who attempts to mimic the performance of an index would incur fees and expenses that would reduce return.
This document is a general communication being provided for informational purposes only. It is educational in nature and not designed to be taken as advice or a recommendation for any specific investment product, strategy, plan feature, or other purpose in any jurisdiction, nor is it a commitment from Raymond James Investment Management or any of its affiliates to participate in any of the transactions mentioned herein. Any examples used are generic, hypothetical, and for illustration purposes only. This material does not contain sufficient information to support an investment decision, and you should not rely on it in evaluating the merits of investing in any securities or products. In addition, users should make an independent assessment of the legal, regulatory, tax, credit, and accounting implications and make their own determinations together with their own professionals in those fields. Any forecasts, figures, opinions, or investment techniques and strategies set out are for information purposes only, based on certain assumptions and current market conditions, and are subject to change without prior notice. All information presented herein is considered to be accurate at the time of production, but no warranty of accuracy is given and no liability in respect of any error or omission is accepted. It should be noted that investment involves risks, the value of investments and the income from them may fluctuate in accordance with market conditions and taxation agreements, and investors may not get back the full amount invested. Both past performance and yields are not reliable indicators of current and future results.
The views and opinions expressed are not necessarily those of the broker/dealer or any affiliates. Nothing discussed or suggested should be construed as permission to supersede or circumvent any broker/dealer policies, procedures, rules, and guidelines.
Sector investments are companies engaged in business related to a specific sector. They are subject to fierce competition and their products and services may be subject to rapid obsolescence. There are additional risks associated with investing in an individual sector, including limited diversification.
Investing in small cap stocks generally involves greater risks, and therefore, may not be appropriate for every investor. The prices of small company stocks may be subject to more volatility than those of large company stocks.
International investing presents specific risks, such as currency fluctuations, differences in financial accounting standards, and potential political and economic instability. These risks are further accentuated in emerging market countries where risks can also include possible economic dependency on revenues from particular commodities or on international aid or development assistance, currency transfer restrictions, and liquidity risks related to lower trading volumes.
Definitions
A correction is a decline in the market price of a security or index of more than 10% from its recent highs but not more than 20%.
Defensive investments provide consistent dividends and stable earnings regardless of whether the overall stock market is rising or falling. Companies with shares considered to be defensive tend to have a constant demand for their products or services and thus their operations are more stable during different phases of the business cycle.
De-grossing occurs when investors rapidly reduce their long and short positions in companies, which can be triggered by perceived market risks or shifts in strategy. This may lead to market volatility and increased correlations.
The U.S. Department of Government Efficiency (DOGE) was established by an executive order that renamed the U.S. Digital Service (USDS). Its stated goal is to maximize governmental efficiency and productivity.
A drawdown is a decline in the returns of a security or group of securities, as measured over a period from the peak of returns to their trough.
The U.S. Federal Reserve dot plot is a chart summarizing the Federal Open Market Committee’s (FOMC) outlook for the federal funds rate. Each dot represents the interest rate forecasted by one of the 12 members of the committee.
Earnings per share (EPS) is calculated as a company’s profit divided by the outstanding shares of its common stock. The resulting number serves as an indicator of a company’s profitability.
Extended is a term used to describe an investment, industry, or sector with performance that has substantially moved away from a longer-term average in a short period of time.
Fiscal policy refers to the tax collection and spending a government uses to influence its country’s economy.
Fund flow is the net of all cash inflows and outflows into and out of a particular financial asset, sector, or index.
Growth investing is a stock-buying strategy that focuses on companies expected to grow at an above-average rate compared to their industry or the market.
Guidance refers statements from the managers of publicly traded companies that indicate whether they expect to realize near-term profits or losses and why.
The Magnificent Seven refers to the seven largest stocks by market capitalization in the S&P 500 Index, as of Dec. 31, 2024. Collectively they made up more than 25% of the market capitalization of the entire index. They are Alphabet, Amazon.com, Apple, Meta Platforms, Microsoft, NVIDIA and Tesla.
Market capitalization, or market cap, refers to the total dollar market value of a company’s outstanding shares of stock.
Mega-cap stocks are the largest publicly traded companies as measured by market capitalization. Generally, this refers to companies with market capitalizations over $200 billion.
Positioning refers to assessments of whether professional investors are, on the whole, bullish or bearish on a particular security, industry, sector, market capitalization or other area of the market, as reflected by the extent to which they are invested in the area of the market in question.
A pullback is a temporary pause or drop in the price of a security that previously had been rising.
A “put from the European central bank” is an adaption of the option term “put,” describing a belief that the European Central Bank would step in and implement policies to limit equity market declines beyond a certain point.
The ReArm Europe Plan is a European Union spending package focused on helping E.U. member states quickly and significantly increase their defense expenditures.
Rotation describes the movement of investments in securities from one industry, sector, factor, or asset class to another as market participants react to or try to anticipate the next stage of the economic cycle.
Stretched, similar to extended, can be used to describe an investment, industry, or sector with performance that has substantially moved away from a longer-term average in a short period of time.
Tailwind is a term used to describe events or market forces that exert a positive influence on an investment’s performance.
Unwinding describes the process of closing out what is often a large or complicated trading position.
The University of Michigan Index of Consumer Sentiment is based on monthly telephone surveys in which at least 500 consumers in the continental United States are asked 50 questions about what they think now and what their expectations are for their personal finances, business conditions, and buying conditions. Their responses are used to calculate monthly measures of consumer sentiment that can be compared to a base value of 100 set in 1966.
Value investing is an investment strategy that involves picking stocks that appear to be trading for less than their intrinsic or book value.
“Whatever it takes” was a remark delivered in speech by European Central Bank president Mario Draghi during the 2012 Eurozone Debt Crisis. His pledge to preserve the euro is referenced when suggesting that financial institutions are ready to take extraordinary actions in support of markets.
Indices
The S&P 500 Index measures changes in stock market conditions based on the average performance of 500 widely held common stocks. It is a market-weighted index calculated on a total return basis with dividend reinvested. The S&P 500 represents approximately 80% of the investable U.S. equity market.
The S&P 500® Equal Weight Index (EWI) includes the same constituents as the capitalization-weighted S&P 500 Index, but each company in the S&P 500 EWI is allocated a fixed weight.
The Russell 2000® Index measures the performance of the small-cap segment of the US equity universe. The Russell 2000 Index is a subset of the Russell 3000® Index and includes approximately 2,000 of the smallest securities based on a combination of their market cap and current index membership.
The Russell 3000® Index measures the performance of the 3,000 largest U.S.-traded stocks, which represent about 96% of the total market capitalization of all U.S. incorporated equity securities.
London Stock Exchange Group plc and its group undertakings (collectively, the “LSE Group”). ©LSE Group 2025. FTSE Russell is a trading name of certain of the LSE Group companies. Russell® is a trademark of the relevant LSE Group companies and is used by any other LSE Group company under license. All rights in the FTSE Russell indexes or data vest in the relevant LSE Group company which owns the index or the data. Neither LSE Group nor its licensors accept any liability for any errors or omissions in the indexes or data and no party may rely on any indexes or data contained in this communication. No further distribution of data from the LSE Group is permitted without the relevant LSE Group company’s express written consent. The LSE Group does not promote, sponsor, or endorse the content of this communication.
M-706651 Exp. 7/17/2025
With volatility running even higher than expected, growth and momentum are the S&P 500 Index’s worst-performing factors year to date while safety factors are beating the index by a wide margin.
Yet the underlying fundamentals of the equity market continue to offer cause for optimism.
This kind of environment underscores the importance of diversification.
Uncertainty persists and the risk-off rotation continues, said Joey Del Guercio, Market Strategy Research Associate at Raymond James Investment Management.
Last week, the S&P 500 Index posted its worst week of the year — down -3.10%.1 At the same time, the Nasdaq Composite Index fell -3.45% and the Russell 2000® Index fell -4.05%. That’s three straight weeks in the red for the S&P 500 and Nasdaq while the Russell 2000 is down six weeks in a row — for its longest streak on record. Much of the post-election optimism that permeated the markets is now effectively washed out.
“Heading into the year, it was a consensus belief that volatility would pick up with the Trump administration,” Del Guercio said. “Despite this, it feels like the first six weeks of the 47th presidency have already shown that no one was sufficiently prepared for the volatility to come.”
Everyone expected a more high-touch administration compared to the Biden administration, but it’s hard not to feel perpetually behind the news cycle considering all of Trump’s executive orders, talk, and tweets; interviews with Treasury Secretary Scott Bessent and Commerce Secretary Howard Lutnick; or myriad other headlines. Tariffs get announced, and then unannounced … before getting announced again. On March 4, the United States imposed tariffs on Mexico and Canada only for them to be amended twice over the following few days.
“For the entirety of this bull market, dips in sentiment were driven by uncertainty about monetary policy, but now that’s taken a backseat to persistently dominant fiscal policy uncertainty,” Del Guercio said. “With such a nebulous backdrop, we’re effectively in no man’s land.”
Things feel worse than they are as the S&P 500 tests its technicals
S&P 500 drawdowns since the beginning of 2020
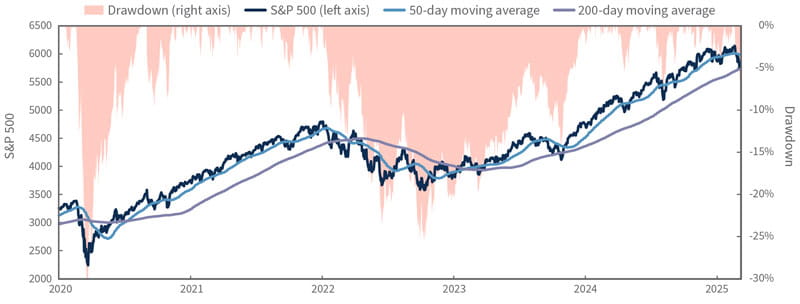
Source: Bloomberg, as of 3/7/25.
The market is at a key technical crossroad with the S&P 500 trading at its 200-day moving average, having briefly broken below it last week for the first time since October 2023 before reclaiming it. At the same time, the VIX – officially, the Chicago Board Options Exchange (CBOE) Volatility Index – is also securely back in the 20s as fears mount. The momentum selloff continued last week, and now just one of the Magnificent Seven constituents is in the green in 2025. The artificial intelligence (AI) exceptionalism that drove the bull market forward to date has faltered meaningfully. Defensive posturing is excruciatingly evident across both sectors and factors. Growth and momentum are by far the worst-performing factors year to date while safety factors like value, dividends, low volatility, quality, and profitability are all beating the S&P 500 by a wide margin. Healthcare (+8.6% year to date), consumer staples (+6.4%), and real estate (+4.4%) are the best-performing sectors in 2025 while consumer discretionary (-10.5%) and information technology (-7.4%) are the worst-performing sectors and are the only sectors to underperform the S&P 500 (-1.7%). A silver lining in all of this is that the S&P 500 is only in a 6% drawdown, the second-deepest drawdown of the bull market, while Del Guercio noted that momentum is resetting.
“Throughout this bull market, pundits clamored about index concentration and valuation, and this pullback is alleviating some of those concerns from my perspective,” he said. “No one can say breadth isn’t expanding.”
What’s not to like?
FactSet S&P 500 fourth-quarter earnings per share (EPS) growth consensus expectations
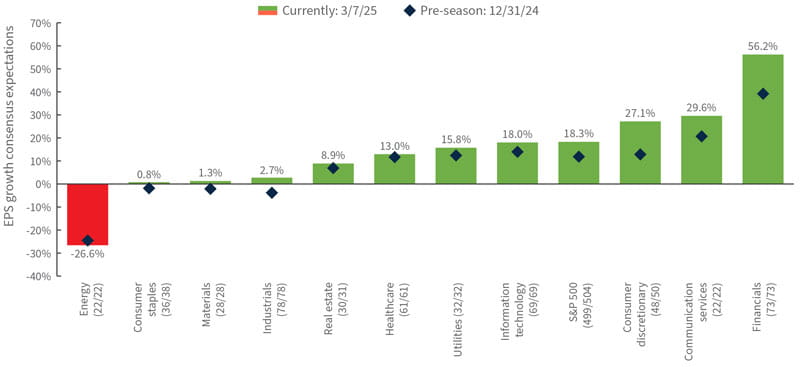
Source: FactSet, as of 3/7/25. The numbers in parentheses indicate the number of companies that have reported fourth-quarter earnings so far, followed by the total number of companies in each category.
“Don’t let the headline-induced pessimism distract you from what’s going right in this bull market,” Del Guercio said. “The underlying fundamentals are a continued cause for optimism.”
This earnings season, 10 of the S&P 500’s 11 sectors posted earnings ahead of consensus expectations. While there are certainly pockets of negative management commentary, he said much of it is idiosyncratic, and the broader trends we’re seeing across the universe are not indicative of a recession. In fact, while a record-setting number of companies have mentioned “tariffs” on their earnings calls this calendar quarter, very few have mentioned “recession,” according to FactSet. Only 13 companies have cited “recession” on their transcripts this quarter, far below the five-year average of 80 mentions and 10-year average of 60, and the lowest level since the first quarter of 2018.
Taking a step back and thinking about valuations, the S&P 500 looks like it’s posting just over 10% earnings per share (EPS) growth in 2024, right around $243 a share, and consensus currently sees about 12% growth in 2025, potentially bringing the S&P 500’s EPS to $271. The index currently trades at a debatably justifiable 25x price-to-earnings (P/E) ratio over the last 12 months. If that multiple holds and we get 12% EPS growth, a back-of-the-napkin estimate puts the index trading around 6775 (25 times 271), Del Guercio said. Even if the multiple compresses a bit from here, or if earnings come in below consensus, the fundamentals are supportive, he said, adding: “This bull market hasn’t been running on fumes.”
Considering how oversold everything is starting to look, Del Guercio said he wouldn’t be surprised to see a bounce, though he would hesitate to trust it until we’ve seen a few good weeks of the indices back on their march higher.
“You don’t want to chase this market higher,” he said. “I believe continued volatility could continue to provide investors with ample potential buying opportunities. I also believe there are still plenty of reasons to be broadly bullish through the remainder of 2025, but investors just shouldn’t get too far ahead of themselves as the short- to mid-term is likely to be choppy.”
This is the kind of environment that underscores the importance of diversification, he said. Be ready to lean into what’s working, get a shopping list together for when these bouts of volatility materialize, and consider investing across a broad range of sectors, sizes, and geographies, he said.
“If you don’t hate at least one part of your portfolio, you’re probably not diversified enough,” Del Guercio said. His key areas to think about include:
Being diversified doesn’t mean shunning the Magnificent Seven. As a cohort, these companies are still high quality, still spit off hundreds of billions of dollars in free cash flow per year, and have still posted strong EPS and revenue growth with little to no debt and impressive business moats. And Del Guercio said they’re not as expensive as some make them out to be.
Playing offense with European defense. It’s no secret that European stocks have been on a tear this year. In fact, U.S. equities have lagged European equities for six straight weeks. One of the biggest drivers of this has been European defense companies which, while technically overbought, continue to look very attractive to Del Guercio going forward with surprisingly light positioning. He would consider any market weakness, such as the announcement of a ceasefire in the Russia-Ukraine war, a potential buying opportunity. The United States’ more openly isolationist stance under the Trump administration forces the hand of its allies in NATO: They need to invest more in their own self-sovereignty. As such, an uptick in global defense spending is a durable structural theme that is likely to persist beyond the current conflicts.
Leaning into dividend growth. While the S&P 500 is down -1.7% year to date, the S&P 500 Dividend Aristocrats Index is up 5.0%. As growth scares in the United States mount, Del Guercio points to steadier growth in the companies that have been able to grow their dividends consistently over time. Dividend growth can provide ballast to portfolios as it’s one of the areas at the intersection of growth and value, he said.
Inflation:
February Consumer Price Index on Wednesday.
February Producer Price Index on Thursday.
Labor:
January Job Openings and Labor Turnover Survey (JOLTS) on Tuesday.
Sentiment:
Federal Reserve Bank of New York Survey of Consumer Expectations (including one-year inflation expectations) on Monday.
February National Federation of Independent Business’s Small Business Optimism Index on Tuesday.
University of Michigan Index of Consumer Sentiment preliminary report for March on Friday.
1 Unless otherwise indicated, all data cited is sourced from Bloomberg as of March 7, 2025.
Risk Information:
Investing involves risk, including risk of loss.
Diversification does not ensure a profit or guarantee against loss.
Disclosures:
Index or benchmark performance presented in this document does not reflect the deduction of advisory fees, transaction charges, or other expenses, which would reduce performance. Indexes are unmanaged. It is not possible to invest directly in an index. Any investor who attempts to mimic the performance of an index would incur fees and expenses that would reduce return.
This document is a general communication being provided for informational purposes only. It is educational in nature and not designed to be taken as advice or a recommendation for any specific investment product, strategy, plan feature, or other purpose in any jurisdiction, nor is it a commitment from Raymond James Investment Management or any of its affiliates to participate in any of the transactions mentioned herein. Any examples used are generic, hypothetical, and for illustration purposes only. This material does not contain sufficient information to support an investment decision, and you should not rely on it in evaluating the merits of investing in any securities or products. In addition, users should make an independent assessment of the legal, regulatory, tax, credit, and accounting implications and make their own determinations together with their own professionals in those fields. Any forecasts, figures, opinions, or investment techniques and strategies set out are for information purposes only, based on certain assumptions and current market conditions, and are subject to change without prior notice. All information presented herein is considered to be accurate at the time of production, but no warranty of accuracy is given and no liability in respect of any error or omission is accepted. It should be noted that investment involves risks, the value of investments and the income from them may fluctuate in accordance with market conditions and taxation agreements, and investors may not get back the full amount invested. Both past performance and yields are not reliable indicators of current and future results.
The views and opinions expressed are not necessarily those of the broker/dealer or any affiliates. Nothing discussed or suggested should be construed as permission to supersede or circumvent any broker/dealer policies, procedures, rules, and guidelines.
Sector investments are companies engaged in business related to a specific sector. They are subject to fierce competition and their products and services may be subject to rapid obsolescence. There are additional risks associated with investing in an individual sector, including limited diversification.
Investing in small cap stocks generally involves greater risks, and therefore, may not be appropriate for every investor. The prices of small company stocks may be subject to more volatility than those of large company stocks.
International investing presents specific risks, such as currency fluctuations, differences in financial accounting standards, and potential political and economic instability. These risks are further accentuated in emerging market countries where risks can also include possible economic dependency on revenues from particular commodities or on international aid or development assistance, currency transfer restrictions, and liquidity risks related to lower trading volumes.
Definitions
Ballast, in finance, can refer to characteristics, factors or trading strategies that mitigate volatility or provide stability to a security or group of securities.
Breadth describes the relationship between the median and the mean of a market index. When a few data outliers result in a mean that is substantially larger (or smaller) than the median of the full data set, then the performance of the entire index is being driven by a “narrow” selection of companies. An index supported by “broad” market movements is one where the median is closer to the mean. Market breadth is said to narrow when a smaller number of more extreme outliers drive the mean of an index further from its median.
Concentration is a term used to describe the extent to which investments in a portfolio, group of portfolios, industry, sector, index, or particular geography or clustered in groups that share specific factors or other characteristics.
A consensus estimate is a forecast of a public company’s projected earnings, the results of a particular industry, sector, geography, asset class, or other category, or the expected findings of a macroeconomic report based on the combined estimates of analysts and other market observers that track the stock or data in question.
The U.S. Consumer Price Index (CPI) measures the change in prices paid by consumers for goods and services.
The U.S. Bureau of Labor Statistics bases the index on prices of food, clothing, shelter, fuels, transportation, doctors’ and dentists’ services, drugs, and other goods and services that people buy for day-to-day living. Prices are collected each month in 75 urban areas across the country from about 6,000 households and 22,000 retailers.
Defensive investment strategies are characterized by rebalancing the investment portfolio regularly to maintain an intended asset allocation. They also typically entail investing in high-quality, short-maturity bonds and blue-chip stocks, diversifying across sectors and countries, and holding cash and cash equivalents in down markets.
Dividend investing focuses on investing in companies that distribute a portion of their profits to shareholders in the form of a dividend.
A drawdown is a decline in the returns of a security or group of securities, as measured over a period from the peak of returns to their trough.
Earnings per share (EPS) is calculated as a company’s profit divided by the outstanding shares of its common stock. The resulting number serves as an indicator of a company’s profitability.
Factor investing is an approach to investing that selects securities based on characteristics associated with higher returns. These characteristics, or factors, can be macroeconomic factors or style factors. Macroeconomic factors are focused on broad risks across asset classes and include the rate of inflation: growth in gross domestic product; and the unemployment rate. Style factors include differences in growth versus value stocks; market capitalization, and industry sector. Factor performance refers to a focus on performance of securities within a particular factor or between groups of different kinds of factors.
Fiscal policy refers to the tax collection and spending a government uses to influence its country’s economy.
Growth investing is a stock-buying strategy that focuses on companies expected to grow at an above-average rate compared to their industry or the market.
The Job Openings and Labor Turnover Survey (JOLTS) program produces monthly data on job openings, hires, and separations compiled by the U.S. Bureau of Labor Statistics. The survey’s job openings rates consider month-to-month changes in the number of job openings reported on both a state and national level.
Low volatility investing is a strategy with a goal of mitigating risk by investing in securities with lower and less-sudden fluctuations in their prices.
The Magnificent Seven refers to the seven largest stocks by market capitalization in the S&P 500 Index, as of Dec. 31, 2024. Collectively they made up more than 25% of the market capitalization of the entire index. They are Alphabet, Amazon.com, Apple, Meta Platforms, Microsoft, NVIDIA and Tesla.
Market capitalization, or market cap, refers to the total dollar market value of a company’s outstanding shares of stock.
A moat, in finance, refers to a business’s ability to maintain competitive advantages in relation to its competitors and thereby to safeguard its market share and long-term profits. Investor Warren Buffett popularized the term.
Momentum investing is a strategy that aims to capitalize on the continuance of an existing market trend. It is a trading strategy in which investors buy securities that are already rising and look to sell them when they look to have peaked. It entails taking long positions on financial instruments with prices trending up and short positions on instruments with prices trending down.
Monetary policy refers to the decisions made by central banks to raise or lower benchmark interest rates or otherwise tighten or loosen credit to influence an economy’s growth, inflation, or employment levels.
A moving average (MA) is a technical analysis tool that smooths out stock price data by creating a constantly updated average price, often over a specified period of time, such as 15, 30, 50, 100, or 200 days.
A multiple, sometimes referred to as the price multiple or earnings multiple, is a measure of a company’s value based on the ratio of its current share price to its earnings per share. This ratio is known as the price-to-earnings ratio, or P/E.
Multiple compression is an effect that takes place when a company’s earnings rise, but its stock price does not move in response. This decreases the company’s financial multiple, and this often reflects a change in investor expectations. In the case of a company that posts flat earnings, a multiple compression could see the stock price fall or, in the event that the company reports falling earnings, the stock price could fall faster than the earnings
The National Federation of Independent Business’s Small Business Optimism Index surveys small and independent business owners on 10 equally weighted and seasonally adjusted variables, including their hiring, investment, and inventory plans, as well as on their economic expectations, assessment of the state of the economy, labor market, credit conditions, and earnings trends. The monthly change of each variable contributes proportionally to the overall monthly change in the index.
NATO, or the North Atlantic Treaty Organization, is a political and military alliance of 32 countries from Europe and North America that is organized to guarantee their security and cooperation.
Overbought is a term used to describe a security or group of securities believed to be trading at a level above its or their intrinsic or fair value.
Oversold is a term used to describe a security or group of securities believed to be trading at a level below its or their intrinsic or fair value.
Positioning refers to assessments of whether professional investors are, on the whole, bullish or bearish on a particular security, industry, sector, market capitalization or other area of the market, as reflected by the extent to which they are invested in the area of the market in question.
Price-to-earnings (P/E) ratios measure a company’s current share price relative to its earnings per share. The ratio is used to help assess a company’s value and is sometimes referred to as the price multiple or earnings multiple.
The Producer Price Index (PPI), published monthly by the U.S. Bureau of Labor Statistics, measures the average change over time in the selling prices received by domestic producers for their output.
Profit factor investing considers the gross profit of an investment divided by the gross loss (including commissions) for the entire trading period. This method is used to assess the amount of profit per unit of risk, with values greater than one indicating a profitable system.
A pullback is a temporary pause or drop in the price of a security that previously had been rising.
Quality investing is a strategy that seeks to invest in companies with low debt, stable earnings, consistent asset growth, and strong corporate governance, as reflected in financial metrics such as ratios of return to equity and debt to equity, as well as to earnings variability.
A risk-off rotation is one where investors seek assets that are considered to be safe havens in bearish market environments.
Rotation describes the movement of investments in securities from one industry, sector, factor, or asset class to another as market participants react to or try to anticipate the next stage of the economic cycle.
The Survey of Consumer Sentiment, produced by the Federal Reserve Bank of New York, tracks consumer expectations regarding inflation, the labor market, and household finances. It is a nationally representative, Internet-based survey of a rotating panel of approximately 1,300 household heads. Respondents participate in the panel for up to 12 months, with a roughly equal number rotating in and out of the panel each month. This allows the survey to observe the changes in expectations and behavior of the same individuals over time.
Technicals refers to technical indicators of historic market data, including price and volume statistics, to which analysts apply a wide variety of mathematical formulas in their study of larger market patterns.
The University of Michigan Index of Consumer Sentiment is based on monthly telephone surveys in which at least 500 consumers in the continental United States are asked 50 questions about what they think now and what their expectations are for their personal finances, business conditions, and buying conditions. Their responses are used to calculate monthly measures of consumer sentiment that can be compared to a base value of 100 set in 1966.
Value investing is an investment strategy that involves picking stocks that appear to be trading for less than their intrinsic or book value.
The VIX — officially known as the Chicago Board Options Exchange (CBOE) Volatility Index — is a real-time market index that represents the market’s expectation of 30-day forward-looking volatility. Derived from the price inputs of the S&P 500 index options, it provides a measure of market risk and investors’ sentiments.
Indices
The S&P 500 Index measures changes in stock market conditions based on the average performance of 500 widely held common stocks. It is a market-weighted index calculated on a total return basis with dividend reinvested. The S&P 500 represents approximately 80% of the investable U.S. equity market.
The S&P 500 Dividend Aristocrats® Index measures the performance of S&P 500 companies that have increased dividends every year for the last 25 consecutive years. The Index treats each constituent as a distinct investment opportunity without regard to its size by equally weighting each company.
The Nasdaq Composite Index is the market capitalization-weighted index of over 2,500 common equities listed on the Nasdaq stock exchange.
The Russell 2000® Index measures the performance of the small-cap segment of the US equity universe. The Russell 2000 Index is a subset of the Russell 3000® Index and includes approximately 2,000 of the smallest securities based on a combination of their market cap and current index membership.
London Stock Exchange Group plc and its group undertakings (collectively, the “LSE Group”). ©LSE Group 2025. FTSE Russell is a trading name of certain of the LSE Group companies. Russell® is a trademark of the relevant LSE Group companies and is used by any other LSE Group company under license. All rights in the FTSE Russell indexes or data vest in the relevant LSE Group company which owns the index or the data. Neither LSE Group nor its licensors accept any liability for any errors or omissions in the indexes or data and no party may rely on any indexes or data contained in this communication. No further distribution of data from the LSE Group is permitted without the relevant LSE Group company’s express written consent. The LSE Group does not promote, sponsor, or endorse the content of this communication.
M-702189 Exp. 7/10/2025
Investors should be wary as many macro indicators approach inflection points.
But things may not be so dire: breadth continues to expand under the surface, and earnings this season are broadly far better than consensus expected heading into the year.
Chief Market Strategist Matt Orton, CFA, recommends caution until investors see more data, and more importantly, how the market reacts.
Pervasive uncertainty around tariffs, policy from Washington, and noisy activity data have caught up to the market, presenting headwinds going forward. The picture is further clouded by weaker activity data intersecting with stubborn inflation and rising inflation expectations that don’t leave the U.S. Federal Reserve with many options.1
“Investor sentiment has experienced death by a thousand cuts over the past month — it feels like we’ve been trudging through mud this year, and that’s unlikely to change in the near term,” said Matt Orton, CFA, Chief Market Strategist at Raymond James Investment Management.
Orton said that investors should be cautious with a number of macro indicators that are approaching inflection points: interest rates look oversold, commodities trends are reversing, momentum continues to unwind, the dollar’s decline has paused (and it could strengthen further with tariffs scheduled to take effect this week), and crypto continues to fall apart. However, he sees reasons for remaining constructive and looking selectively for dips that investors could consider buying if markets see a more meaningful pullback.
“Investor sentiment looks washed out with the American Association of Individual Investors Sentiment Survey showing the lowest ratio of bulls to bears since September 2022, just before the start of the current bull market,” Orton said.
Rotation beneath the surface remains healthy, Orton said, with financial and defensive companies delivering relatively stronger performance. Europe’s healthy relative returns have attracted investor dollars, but Orton said that its rally might need to reset; market prices have already incorporated good news, and positive catalysts may slow as earnings season comes to a close.
“My outlook for 2025 was predicated on diversification across sectors, geographies, and asset classes,” Orton said. “That has worked well this year, and given the macro uncertainty that’s unlikely to subside, investors should consider continuing to lean in to building better diversification.”
From tariffs to Ukraine envolvment to a crypto reserve: The news never stops
Baker-Bloom-Davis U.S. Economic Policy Uncertainty Index, monthly since 2015
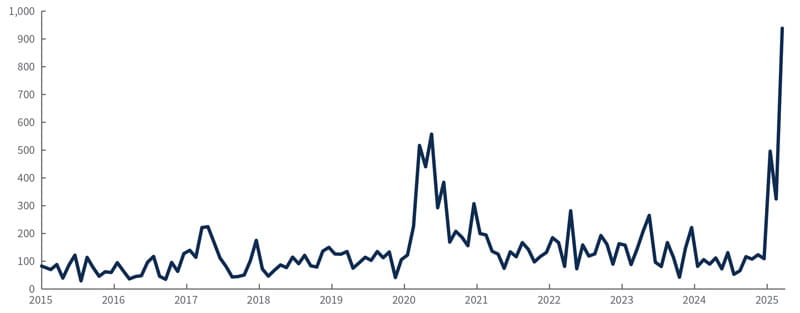
Source: Bloomberg, as of 2/28/25.
For Orton, inflation and the challenging macro setup remain the biggest areas of concern. “It’s probably not worth putting money to work until we see how this starts to resolve,” he said. “Activity data has been showing signs of cooling, and fixed income markets have certainly been behaving as if there are risks to growth going forward.” On Friday, the Federal Reserve GDPNow™ forecast tumbled to -1.5%, its lowest level in years. The Citigroup Economic Surprise Index also declined.
Orton said that the actual impact of tariffs and the Department of Government Efficiency (DOGE) have been quite limited thus far, but they have had a much larger impact on market narratives. Consumer confidence is starting to deteriorate concurrently with a sharp upward movement in inflation expectations. FactSet data shows that during the fourth quarter, CEOs mentioned tariffs during their earnings calls more than any other period on record, and Orton said that their concerns could risk delaying new projects or hiring plans.
“There is a very real risk that uncertainty and weakening consumer confidence could start to permeate into the real economy,” Orton said. “The market is clearly focusing on these growing risks right now.” Last week, rate cut expectations increased meaningfully — markets are now pricing in the possibility of nearly three rate cuts from the U.S. Federal Reserve this year, up from two at the start of last week. Orton added that the market’s selloff last week — driven by several influences, but occurring after NVIDIA reported its earnings — also highlighted the risks to an unwinding of very low correlation across the equity market.
“While risks are starting to mount, it’s too early to change my bullish bias on the market for 2025,” Orton said. “Rotation is the lifeblood of any bull market, and it’s encouraging to see the broader market continue to offset the breakdown of the Magnificent Seven.”
Year to date, the performance of the S&P 500® Equal Weight Index has been nearly double that of the capitalization-weighted S&P 500 Index, delivering +2.87% and +1.44%, respectively. Orton pointed out that 62% of S&P 500 Index constituents are positive, 57% of constituents are beating the average performance of the index, and nearly 50% of constituents are up more than 5% year to date. “That doesn’t seem so dire,” he said.
“Of the top 10 year-to-date contributors to index performance, only one is a Magnificent Seven company. The rest are mostly financials and pharmaceuticals,” Orton said. He expects that earnings for the S&P Index’s 493 other companies will continue looking like they will converge with its Magnificent Seven companies this year, which could support further rotation. He also thinks that some technology companies that fell out of favor with investors could recover when sentiment starts to reverse.
Orton recommends caution until investors see how data comes in at the start of March, and more importantly, how the market reacts. He said that last Thursday’s selloff highlighted what can happen when there aren’t enough buyers in the market, which is largely a result of sentiment. “We need to see the market react positively to good news and take bad news in stride,” he said. Orton is also concerned about a bounce in the 10-year U.S. Treasury yield. Its meaningful move, back to 4.20%, is at the lower end of the range he thinks investors are stuck in. Higher yields could pressure some of the large-cap companies with higher leverage and strain companies with smaller market caps even further.
Did all the talk of U.S. exceptionalism at the end of last year mark a peak in the U.S. share of technology companies and global indices? Orton is not so sure about that. “Fourth-quarter earnings growth for the S&P 500 Index sits at 18.4%, nearly 7% above consensus,” he said.
Expectations for 2025 have been pared back more than normal, but Orton said that 2025 earnings per share (EPS) numbers for S&P 500 companies are still expected to post double digits. “That’s not the case in many other markets. I think the better takeaway is that diversification matters, and investors are increasingly allocating to markets where there is an intersection between growth and valuation, which includes markets overseas,” he said.
European financial companies have been Orton’s favored sector for the past few months, and that remains the case. There have been significant inflows to this part of the market, notably from long-only managers. Fourth-quarter EPS for banks are running well above expectations.
European defense is technically overbought, but Orton said it still looks attractive from a valuation perspective; he recommends viewing selloffs around the Trump administration’s policy shifts on Ukraine as an opportunity to consider adding exposure. “I expect that we’ll see a loosening of financing restrictions around common funds, a growing focus on cross-border procurement and investment, and a growing focus on peace through strength for Europe,” Orton said. They could all provide strong growth tailwinds for European defense.
Updates from Washington and economic data releases will make for a busy week. Unless there is another last-minute reprieve, proposed tariffs on Canada and Mexico are due to go into effect Tuesday. Also on Tuesday, China will be charged an additional 10% tariff and President Donald Trump is scheduled to deliver a speech to a joint session of the U.S. Congress.
On the economic front, the Institute for Supply Management (ISM) Manufacturing ISM® Report On Business® will be released on Monday, the Beige Book and the Services ISM® Report on Business® on Wednesday, and the February Employment Situation Summary on Friday. U.S. Federal Reserve Chair Jerome Powell will speak on Friday, just hours after the February jobs report is released.
Overseas, Thursday’s European Central Bank policy decision will be front and center in Europe. The European Union’s special summit on military aid for Ukraine and bolstering the bloc’s defenses is also worth watching. In Asia, Chinese Premier Li Qiang is expected to deliver a report on the nation’s 2025 growth target at the National People’s Congress.
1 Unless otherwise indicated, all data cited is sourced from FactSet as of Feb. 28, 2025.
Risk Information:
Investing involves risk, including risk of loss.
Diversification does not ensure a profit or guarantee against loss.
Disclosures:
Index or benchmark performance presented in this document does not reflect the deduction of advisory fees, transaction charges, or other expenses, which would reduce performance. Indexes are unmanaged. It is not possible to invest directly in an index. Any investor who attempts to mimic the performance of an index would incur fees and expenses that would reduce return.
This document is a general communication being provided for informational purposes only. It is educational in nature and not designed to be taken as advice or a recommendation for any specific investment product, strategy, plan feature, or other purpose in any jurisdiction, nor is it a commitment from Raymond James Investment Management or any of its affiliates to participate in any of the transactions mentioned herein. Any examples used are generic, hypothetical, and for illustration purposes only. This material does not contain sufficient information to support an investment decision, and you should not rely on it in evaluating the merits of investing in any securities or products. In addition, users should make an independent assessment of the legal, regulatory, tax, credit, and accounting implications and make their own determinations together with their own professionals in those fields. Any forecasts, figures, opinions, or investment techniques and strategies set out are for information purposes only, based on certain assumptions and current market conditions, and are subject to change without prior notice. All information presented herein is considered to be accurate at the time of production, but no warranty of accuracy is given and no liability in respect of any error or omission is accepted. It should be noted that investment involves risks, the value of investments and the income from them may fluctuate in accordance with market conditions and taxation agreements, and investors may not get back the full amount invested. Both past performance and yields are not reliable indicators of current and future results.
The views and opinions expressed are not necessarily those of the broker/dealer or any affiliates. Nothing discussed or suggested should be construed as permission to supersede or circumvent any broker/dealer policies, procedures, rules, and guidelines.
Sector investments are companies engaged in business related to a specific sector. They are subject to fierce competition and their products and services may be subject to rapid obsolescence. There are additional risks associated with investing in an individual sector, including limited diversification.
Investing in small cap stocks generally involves greater risks, and therefore, may not be appropriate for every investor. The prices of small company stocks may be subject to more volatility than those of large company stocks.
International investing presents specific risks, such as currency fluctuations, differences in financial accounting standards, and potential political and economic instability. These risks are further accentuated in emerging market countries where risks can also include possible economic dependency on revenues from particular commodities or on international aid or development assistance, currency transfer restrictions, and liquidity risks related to lower trading volumes.
Definitions
The American Association of Individual Investors Sentiment Survey reflects answers offered each week by AAII members to the question: What direction do they feel the stock market will take in the next six months? Answers are sorted into bullish, neutral, and bearish categories. The survey’s ratio of bulls to bears is calculated by subtracting bullish responses from bearish responses.
The Baker-Bloom-Davis U.S. Economic Policy Uncertainty Index identifies articles from a panel of 10 major newspapers (USA Today, the Miami Herald, the Chicago Tribune, the Washington Post, the Los Angeles Times, the Boston Globe, the San Francisco Chronicle, the Dallas Morning News, the Houston Chronicle, and the Wall Street Journal) that contain one or more terms related to economics, policy, or uncertainty.
The Beige Book, officially known as the U.S. Federal Reserve’s Summary of Commentary on Current Economic Conditions by Federal Reserve District, is published eight times per year. The summary gathers anecdotal information on current economic conditions through reports from bank and branch directors and interviews with key business contacts, economists, market experts, and other sources.
The Citigroup Economic Surprise Index tracks the relationship between economic data and economists’ expectations for a range of economies. A positive reading means that data releases have been stronger than expected, and a negative reading means that data releases have been worse than expected.
A consensus estimate is a forecast of a public company’s projected earnings, the results of a particular industry, sector, geography, asset class, or other category, or the expected findings of a macroeconomic report based on the combined estimates of analysts and other market observers that track the stock or data in question.
Correlation is a statistic that measures the degree to which two securities move in relation to each other.
Earnings per share (EPS) is calculated as a company’s profit divided by the outstanding shares of its common stock. The resulting number serves as an indicator of a company’s profitability.
The payroll report, officially known as the Employment Situation Summary, is a monthly U.S. Bureau of Labor Statistics (BLS) report tracking nonfarm payroll employment and the national unemployment rate, with data on changes in average hourly earnings, and job trends in public and private sectors of employment. The report is based on surveys of households and employers.
Federal Reserve GDPNow™ is a model estimate for real gross domestic product (GDP) growth (seasonally adjusted annual rate). It is produced by the Federal Reserve Bank of Atlanta, but it is not an official forecast of the Atlanta Fed. Rather, it is best viewed as a running estimate of real GDP growth based on available economic data for the current measured quarter. There are no subjective adjustments made to GDPNow. The estimate is based solely on the mathematical results of the model.
Growth investing is a stock-buying strategy that focuses on companies expected to grow at an above-average rate compared to their industry or the market.
Guidance refers statements from the managers of publicly traded companies that indicate whether they expect to realize near-term profits or losses and why.
Headwind is a term used to describe events or market forces that hinder the prospects for performance in an individual investment or group of investments.
The Institute for Supply Management (ISM) Manufacturing ISM® Report On Business®, also known as the Purchasing Managers’ Index (PMI), measures the prevailing direction of economic trends in the manufacturing sector. It consists of an index summarizing whether market conditions as reported in a monthly survey of supply chain managers are expanding, staying the same, or contracting.
The Magnificent Seven refers to the seven largest stocks by market capitalization in the S&P 500 Index, as of Dec. 31, 2024. Collectively they made up more than 25% of the market capitalization of the entire index. They are Alphabet, Amazon.com, Apple, Meta Platforms, Microsoft, NVIDIA and Tesla.
Market capitalization, or market cap, refers to the total dollar market value of a company’s outstanding shares of stock.
Momentum investing is a strategy that aims to capitalize on the continuance of an existing market trend. It is a trading strategy in which investors buy securities that are already rising and look to sell them when they look to have peaked. It entails taking long positions on financial instruments with prices trending up and short positions on instruments with prices trending down.
Oversold is a term used to describe a security or group of securities believed to be trading at a level below its or their intrinsic or fair value.
Positioning refers to assessments of whether professional investors are, on the whole, bullish or bearish on a particular security, industry, sector, market capitalization or other area of the market, as reflected by the extent to which they are invested in the area of the market in question.
A pullback is a temporary pause or drop in the price of a security that previously had been rising.
Rotation describes the movement of investments in securities from one industry, sector, factor, or asset class to another as market participants react to or try to anticipate the next stage of the economic cycle.
The Services ISM® Report on Business® is produced by the Institute for Supply Management (ISM) and is based on data compiled from purchasing and supply executives in a wide variety of industries nationwide. Survey responses reflect the change, if any, in the current month compared to the previous month in supplier deliveries along with seasonally adjusted business activity, new orders, and employment.
Tailwind is a term used to describe events or market forces that exert a positive influence on an investment’s performance.
Unwinding describes the process of closing out what is often a large or complicated trading position.
Value investing is an investment strategy that involves picking stocks that appear to be trading for less than their intrinsic or book value.
Indices
The S&P 500 Index measures changes in stock market conditions based on the average performance of 500 widely held common stocks. It is a market-weighted index calculated on a total return basis with dividend reinvested. The S&P 500 represents approximately 80% of the investable U.S. equity market.
The S&P 500® Equal Weight Index (EWI) includes the same constituents as the capitalization-weighted S&P 500 Index, but each company in the S&P 500 EWI is allocated a fixed weight.
M-698438 Exp. 7/3/2025
