“
”Markets in Focus
Timely analysis of market moves and sectors of opportunity
Last week’s bounce in equities was meaningful and supported by fundamental drivers, courtesy of positive earnings surprises.
This week could be critical, with a couple of key economic reports and earnings from a third of the S&P 500 Index, including most of the Magnificent Seven.
Still, risks remain. So Matt Orton, CFA, doesn’t see this as a time to buy the market aggressively. Areas he’s watching include artificial intelligence, international markets, dividend growers, and municipal bonds.
You could forgive investors for feeling like they have been trapped in a bizarre and dramatic reality TV show over the past month, with virtually every day bringing a new challenge to tackle and survive.
“It has been a true test of our skills as investors,” said Matt Orton, CFA, Chief Market Strategist at Raymond James Investment Management. “But based on signals from the producers – that is, the White House – it looks like we may be getting a bit closer to the finale of this season, at least.”
The good news is that the bounce in equities last week was meaningful and supported by actual fundamentals in positive earnings surprises. April 22 and 23 saw a much broader reversal of the month’s established trends: the dollar rallied, gold plunged, yields dropped, the yield curve flattened, and credit tightened.1
And this week could be critical, with a third of the S&P 500 Index reporting earnings, including the bulk of the Magnificent Seven. “There is still a lot of damage to unwind, and it’s impossible to say with confidence whether the worst is behind us from Season 1 of the Trump tariff reality show, or if we’re just setting things up for another season,” Orton said. “This is why I don’t think we can get complacent. I have cautioned against getting too pessimistic, but I also don’t think this is the right time to aggressively buy the market.”
Rather, Orton continues to focus on the potential benefits of leaning into diversification – across asset classes, geographies, and sectors and industries – and to consider using downside opportunistically in cases where high-quality companies have been thrown out with the bathwater. He believes plenty of potential opportunities remain, and he expects earnings season to provide the clarity on the durability of long-term secular growth themes.
The most important takeaway from last week is the willingness of investors to take risk again, Orton said. It seems like the markets forced President Trump to pivot with respect to his threats to fire U.S. Federal Reserve (Fed) Chair Jerome Powell (for now). Meanwhile, cooler heads in the administration could be making some progress on substantially reducing the overall tariff rate with China.
Bitcoin, which Orton sees as a proxy for risk appetite, jumped more than 10%, high-yield credit spreads came in over 50 basis points (bps), and risk-off currencies like the Swiss franc and Japanese yen weakened along with gold. At the start of last week, Trump had overseen the worst start to a presidency for equities in a century. The recent relief rally notwithstanding, it is also poised to be the worst first 100 days for the dollar since Richard Nixon, who took the United States off the gold standard.
“Perhaps we have reached peak pessimism,” Orton said. “If so, maybe the market can finally start to normalize from all of the extreme volatility across asset classes and begin to build a base upon which we can move higher. Market bottoms are only fully established when bad news is shrugged off, and perhaps we’re starting to get there. I’m encouraged to see reasonably strong market breadth, but plenty of risks remain as we head into the busiest week of earnings and as releases of economic data pick up.”
Trust issues?
The U.S. Dollar Index is heading toward the worst first 100 days of a presidency since Richard Nixon’s second term
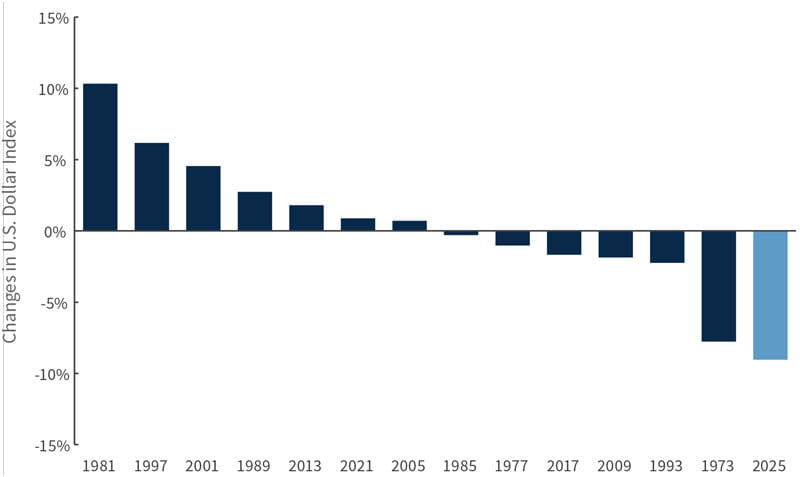
Source: Bloomberg, as of 4/25/25.
Investors could get plenty of news this week to test whether the market can shrug off bad news as earnings season picks up. While the percentage of companies posting earnings beats is running below average, the first-quarter blended year-over-year earnings growth rate for the S&P 500 stands at 10.1% versus the 7.2% that had been expected. If this trend holds, it would mark the second straight quarter of double-digit earnings growth reported by the index.
Given concerns about tariffs and higher costs, profit margins also remain quite strong. The blended net profit margin for the S&P 500 for the first quarter of 2025 stands at 12.4%. While that’s below the previous quarter’s net profit margin, it’s above the year-ago net profit margin and above the 5-year average of 11.7%. In fact, this quarter marks the fourth consecutive quarter that the S&P 500 is reporting a net profit margin above 12%.
“This is a decent reminder of the strength of corporate America,” Orton said. “That said, guidance certainly doesn’t exude confidence, and I can’t help but worry about negative earnings revisions and consensus expectations that are still too rosy.”
Specifically, Orton noted that the earnings revision ratio for the S&P 500 is near a record low and bottom-up earnings per share expectations for 2025 have only come down about 2%. This is a reminder to tread carefully, he said, and to be very specific when considering risks to add into portfolios. Meanwhile, he believes the significant drop seen across the Magnificent Seven could create opportunities in businesses with strong, long-term durable growth themes. The tone set by this group could directly impact price action across the rest of the market.
“The lack of bad news from the White House last week has allowed the dust to settle just a bit across global equities,” Orton said. “I think there is scope for a recovery to start taking shape, absent a bad payroll report or very bad earnings from the Magnificent Seven this week.”
Structurally, he said, the possibility for a recovery has been supported by hedge funds reducing their riskier investments to 2-year lows and by a scaling back of systematic positioning that has left room for renewed investment as volatility normalizes. Meanwhile, retail flows have held up, and U.S. companies could start repurchasing their own shares as the blackout windows that restrict buybacks expire in the coming weeks.
It’s also hard to be too bearish when literally everyone has been bearish, Orton said. But sentiment looks to be bottoming in the American Association of Individual Investors Sentiment Survey. That, he said, plus volatility normalizing, credit spreads tightening, and improving crypto markets all suggest peak bearishness could be behind us.
“I’m increasingly looking for opportunities to check items off my shopping list, being very specific in the idiosyncratic risk that I want to add into a portfolio,” he said. “Expect more uncertainty, and expect another Truth Social bomb that sends the market sideways. Still, I’m confident that the worst left-tail risks have been removed. I believe diversification remains critical, and we finally have a chance to consider some changes to help our portfolios provide us with the balance that could help us successfully navigate choppy waters.”
Areas where Orton is looking for opportunities include:
Artificial intelligence (AI). The current backdrop could support a bounce in oversold equities and high-beta stocks, Orton said. In particular, the AI space is gaining momentum, with AI datacenters, power infrastructure, and the AI momentum factor showing signs of inflection. Strong earnings have forced short squeezes, putting upward pressure on prices, and investors who missed the runs last year could have a chance to consider some AI-related companies at favorable valuations, especially if there’s good news this week from Magnificent Seven companies with respect to AI.
Global opportunities remain. The United States has certainly inflicted unnecessary damage across asset markets, and Orton believes there could be some sort of structural shift in capital away from U.S. markets. This could put long-term downward pressure on the dollar, though its recent stabilization is a welcome respite.
This shift, however, is not a “sell everything” in the U.S. trade, he said. It’s reflected more at the margin, by European institutions taking profits from the Magnificent Seven and shifting domestically, as well as by the inclination among international investors to buy the dips in their local markets instead of buying the U.S. market generally.
It’s also worth pointing out that Europe-focused equity funds recorded an inflow of $6 billion last week, the largest in eight years. Based on conversations he has had with trading desks and long-only managers, Orton believes most of these flows are just temporary tilts by global funds rather than true positioning changes. That means there could be more shifts to go should performance in international markets remain strong.
All of this provides a reminder that there are potential opportunities to diversify portfolios across global markets, Orton said. He does worry that some of the trades that held up well during the market selloff like European Union defense contractors or rate-sensitive banks are more susceptible to downside should their earnings miss estimates, but he said that too could present a potential buying opportunity. We’ve also seen strength across other global markets like India, where a nearly 10% rally in the NIFTY 50 Index has left the market in the green by about 2% year to date.
Portfolio ballasts. Dividend growers have been a bright spot throughout April’s volatility, though they underperformed last week as higher-beta stocks rose. Orton favors continuing to consider these higher-quality companies because of the many negative catalysts that could come from Washington, especially around tariff policy toward China. He also believes in focusing on stock selection: Many traditional players in the consumer or energy space might look appealing right now, but there are some real challenges in this environment. He believes there also remain some attractive opportunities in the fixed income market, notably municipal bonds. Tax-equivalent yields remain at the most attractive level in more than a decade, and he noted that the quality of many of these bonds isn’t really impacted by tensions over tariffs.
Key U.S. economic reports this week include first-quarter gross domestic product (GDP) on Wednesday, the Institute of Supply Management’s manufacturing Purchasing Managers’ Index on Thursday, and the payroll report on Friday. First-quarter GDP might already be quite stale, Orton said, but it could show the degree to which demand has been pulled forward in an effort to avoid tariffs. On the jobs front, weekly data has been strong and anecdotal evidence has been weak, so Orton believes this will be a very important release, particularly for the Fed. An unexpectedly resilient report coupled with rising inflation risks would align more with Orton’s view that there are risks that the Fed could cut or raise interest rates this year. The Fed is in its blackout period ahead of its May 6-7 Federal Open Market Committee meeting.
Outside of the United States, the euro area, Canada and Mexico also report on GDP this week, and the euro area and Australia release inflation readings. The Bank of Japan is expected to hold its policy rate at 0.5% on Thursday.
On the earnings front, more than 33% of S&P 500 companies and over 40% of the index’s market capitalization reports quarterly results this week. This includes four members of the Magnificent Seven.
1 Unless otherwise indicated, all data cited is sourced from Bloomberg as of April 25, 2025.
Risk Information:
Investing involves risk, including risk of loss.
Diversification does not ensure a profit or guarantee against loss.
Disclosures:
Index or benchmark performance presented in this document does not reflect the deduction of advisory fees, transaction charges, or other expenses, which would reduce performance. Indexes are unmanaged. It is not possible to invest directly in an index. Any investor who attempts to mimic the performance of an index would incur fees and expenses that would reduce return.
This document is a general communication being provided for informational purposes only. It is educational in nature and not designed to be taken as advice or a recommendation for any specific investment product, strategy, plan feature, or other purpose in any jurisdiction, nor is it a commitment from Raymond James Investment Management or any of its affiliates to participate in any of the transactions mentioned herein. Any examples used are generic, hypothetical, and for illustration purposes only. This material does not contain sufficient information to support an investment decision, and you should not rely on it in evaluating the merits of investing in any securities or products. In addition, users should make an independent assessment of the legal, regulatory, tax, credit, and accounting implications and make their own determinations together with their own professionals in those fields. Any forecasts, figures, opinions, or investment techniques and strategies set out are for information purposes only, based on certain assumptions and current market conditions, and are subject to change without prior notice. All information presented herein is considered to be accurate at the time of production, but no warranty of accuracy is given and no liability in respect of any error or omission is accepted. It should be noted that investment involves risks, the value of investments and the income from them may fluctuate in accordance with market conditions and taxation agreements, and investors may not get back the full amount invested. Both past performance and yields are not reliable indicators of current and future results.
The views and opinions expressed are not necessarily those of the broker/ dealer or any affiliates. Nothing discussed or suggested should be construed as permission to supersede or circumvent any broker/dealer policies, procedures, rules, and guidelines.
There are risks associated with dividend investing, including that dividend-issuing companies may choose not to pay a dividend, may not have the ability to pay, or the dividend may be less than what is anticipated. Dividend-issuing companies are subject to interest rate risk and high dividends can sometimes signal that a company is in distress. Dividends are not guaranteed and must be authorized by the company’s board of directors.
Sector investments are companies engaged in business related to a specific sector. They are subject to fierce competition and their products and services may be subject to rapid obsolescence. There are additional risks associated with investing in an individual sector, including limited diversification.
Investing in small cap stocks generally involves greater risks, and therefore, may not be appropriate for every investor. The prices of small company stocks may be subject to more volatility than those of large company stocks.
International investing presents specific risks, such as currency fluctuations, differences in financial accounting standards, and potential political and economic instability. These risks are further accentuated in emerging market countries where risks can also include possible economic dependency on revenues from particular commodities or on international aid or development assistance, currency transfer restrictions, and liquidity risks related to lower trading volumes.
Commodity-linked investments may be more volatile and less liquid than the underlying instruments or measures, and their value may be affected by the performance of the overall commodities baskets as well as weather, disease, and regulatory developments.
Investing in bonds involves risks that may adversely affect the value of your investment such as inflation risk, credit risk, call risk, interest rate risk, and liquidity risk, among others. The two most prominent factors are interest rate movements and the credit worthiness of the bond issuer. Investors should pay careful attention to the types of fixed income securities that comprise their portfolios and remember that, as with all investments, there is the risk of loss of capital.
Definitions
The American Association of Individual Investors Sentiment Survey reflects answers offered each week by AAII members to the question: What direction do they feel the stock market will take in the next six months? Answers are sorted into bullish, neutral, and bearish categories. The survey’s ratio of bulls to bears is calculated by subtracting bullish responses from bearish responses.
Basis points (bps) are measurements used in discussions of interest rates and other percentages in finance. One basis point is equal to 1/100th of 1%, or 0.01%.
A beat is when a company’s reported earnings or other business results exceed or are better than the expectations of analysts and others who follow the company’s stock.
Beta is a measure of the volatility or systemic risk of a security, group of securities, or portfolio compared with another security, group of securities, portfolio, or the market as a whole.
Blended results combine actual results such as earnings or other metrics for companies that have reported earnings and estimated results for companies that have yet to report.
Bottoms-up earnings per share expectations are forecasts of a company’s EPS based on an analysis of a range of company performance metrics that feed into revenue.
Breadth describes the relationship between the median and the mean of a market index. When a few data outliers result in a mean that is substantially larger (or smaller) than the median of the full data set, then the performance of the entire index is being driven by a “narrow” selection of companies. An index supported by “broad” market movements is one where the median is closer to the mean.
A blackout period for share buybacks refers to a period around the time that earnings are reported that a company and its employees are banned from buying or selling shares in the company.
A consensus estimate is a forecast of a public company’s projected earnings, the results of a particular industry, sector, geography, asset class, or other category, or the expected findings of a macroeconomic report based on the combined estimates of analysts and other market observers that track the stock or data in question.
Credit or credits are generic terms for fixed income securities such as corporate bonds, mortgage- or asset-backed securities, municipal bonds, or emerging market bonds.
A credit spread is the difference in yield between a U.S. Treasury bond and another debt security with the same maturity but different credit quality. Also referred to as “bond spreads” or “default spreads,” credit spreads are measured in basis points, with a 1% difference in yield equaling a spread of 100 basis points. Credit spreads reflect the risk of the debt security being compared with the Treasury bond, which is considered to be risk-free. Higher quality securities have a lower chance of the issuer defaulting. Lower quality securities have a higher chance of the issuer defaulting.
Credit tightening is a decline in lending activity by financial institutions brought on by a sudden shortage of funds.
Dividend growers are companies that have followed a policy of consistently increasing dividends every year over a period of years.
Dividend payers are the companies that distribute a portion of their profits to shareholders in the form of a dividend.
Earnings per share (EPS) is calculated as a company’s profit divided by the outstanding shares of its common stock. The resulting number serves as an indicator of a company’s profitability.
Earnings revision ratio refers to the ratio of analysts’ earnings upgrades to downgrades for a given group of stocks.
An earnings surprise is when a company’s reported earnings either exceed or come in below the expectations of analysts who cover the stock.
The Federal Open Market Committee (FOMC) consists of 12 members: the seven members of the Board of Governors of the Federal Reserve System; the president of the Federal Reserve Bank of New York; and four of the remaining 11 Reserve Bank presidents, who serve one-year terms on a rotating basis. The FOMC holds eight regularly scheduled meetings per year at which it reviews economic and financial conditions, determines the appropriate stance of monetary policy, and assesses the risks to its long-run goals of price stability and sustainable economic growth. The FOMC observes a blackout period, which begins at midnight of the second Saturday before each meeting. During the blackout periods, committee members do not make public comments about macroeconomic developments or monetary policy issues.
Fund flow is the net of all cash inflows and outflows into and out of a particular financial asset, sector, or index. It typically is measured on a quarterly or monthly basis. Investors and others look at the direction of fund flows for indications about the health of specific securities and sectors or the overall market.
Gross domestic product (GDP) is the total value of goods and services provided in an economy during a specified period, often one quarter or one year.
Guidance refers to statements from the managers of publicly traded companies that indicate whether they expect to realize near-term profits or losses and why.
High-yield bonds pay higher interest rates because they have lower credit ratings than investment-grade bonds. High-yield bonds have credit ratings below BBB- from Standard & Poor’s or below Baa3 from Moody’s.
The Institute for Supply Management (ISM) Manufacturing ISM® Report On Business®, also known as the Purchasing Managers’ Index (PMI), measures the prevailing direction of economic trends in the manufacturing sector. It consists of an index summarizing whether market conditions as reported in a monthly survey of supply chain managers are expanding, staying the same, or contracting. A long position refers to the purchase of a security with the expectation that it will rise in value, reflecting a bullish attitude.
The Magnificent Seven refers to the seven largest stocks by market capitalization in the S&P 500 Index, as of Dec. 31, 2024. Collectively they made up more than 25% of the market capitalization of the entire index. They are Alphabet, Amazon.com, Apple, Meta Platforms, Microsoft, NVIDIA and Tesla.
Market capitalization, or market cap, refers to the total dollar market value of a company’s outstanding shares of stock.
Momentum factor stocks benefit from the continuance of an existing and often accelerating market trend. In momentum trading, investors buy securities that are already rising and look to sell them when they look to have peaked. This strategy entails taking long positions on financial instruments with prices trending up and short positions on instruments with prices trending down.
A net profit margin, often shortened to net margin, measures how much net income or profit a company generates as a percentage of revenue. It can be expressed as a percentage or a decimal.
Oversold is a term used to describe a security or group of securities believed to be trading at a level below its or their intrinsic or fair value.
The payroll report, officially known as the Employment Situation Summary, is a monthly U.S. Bureau of Labor Statistics (BLS) report tracking nonfarm payroll employment and the national unemployment rate, with data on changes in average hourly earnings, and job trends in public and private sectors of employment. The report is based on surveys of households and employers.
A policy rate is an interest rate set by a central bank or other monetary authority to influence the evolution of an economy’s monetary variables such as consumer prices, exchange rates, or credit expansion.
Positioning refers to assessments of whether professional investors are, on the whole, bullish or bearish on a particular security, industry, sector, market capitalization or other area of the market, as reflected by the extent to which they are invested in the area of the market in question.
A risk-off asset is one that is considered to be a safe haven in bearish market environments. In contrast, a risk-on investment is typically more fueled by a strong growth environment and is more apt to rise when good news fuels bullish sentiment and investor expectations of favorable risk/reward ratios.
Secular trends are large-scale and ongoing changes in economies and societies that have the potential to drive broad and lasting economic, technological, social or other kinds of changes.
A short squeeze refers to what happens when the price of an asset rises sharply and forces short-sellers who had bet that its price would fall to buy it instead in order to avoid incurring even greater losses. In turn, those purchases put more upward pressure on the asset price.
Systematic positioning refers to decisions to invest in and hold securities with prices that stay within parameters set by the investment manager.
Tail risk describes a form of portfolio risk associated with the increased possibility that an investment will move more than three standard deviations from the mean in a normal distribution. Left tail risks refer to unusually large losses.
Tax-equivalent yield is the interest rate that a taxable bond must pay to provide the same yield as a comparable tax-exempt municipal bond.
A yield curve is a line that plots yields (interest rates) of bonds having equal credit quality but differing maturity dates. The slope of the yield curve gives an idea of future interest rate changes and economic activity.
Indices
The S&P 500 Index measures changes in stock market conditions based on the average performance of 500 widely held common stocks. It is a market-weighted index calculated on a total return basis with dividend reinvested. The S&P 500 represents approximately 80% of the investable U.S. equity market.
The NIFTY 50 Index is a stock index on the National Stock Exchange of India that tracks the largest assets in the Indian equity market. It is diversified across 13 sectors of the Indian economy: financial services, information technology, consumer goods, oil and gas, automobiles, telecommunications, construction, pharmaceuticals, metals, power, cement and cement products, fertilizers and pesticides, and media and entertainment.
The U.S. Dollar Index is a measure of the value of the U.S. dollar relative to the value of a basket of currencies from most of the U.S.’s most significant trading partners.
M-732210 Exp. 8/28/2025
This is a time for moderation, given the mix of high levels of uncertainty and political noise, tempered by consumer trends and earnings that are still holding up.
Despite President Trump’s social media complaints about U.S. monetary policy, there doesn’t seem to be a need for now to worry about the independence of the U.S. Federal Reserve or the removal of Fed Chair Jerome Powell.
In this environment, Matt Orton, CFA, is thinking about dividend growth, the beneficiaries of secular growth, and the importance of diverse asset allocations.
Markets finally started to settle down last week after the crazy start to April, but that doesn’t mean that we’re out of the woods, said Matt Orton, CFA, Chief Market Strategist at Raymond James Investment Management.
Macroeconomic uncertainty remains elevated, and political noise is decibels higher than the chaos to which we’ve become accustomed. Questions about the future of U.S. Federal Reserve (Fed) Chair Jerome Powell and the Fed’s independence didn’t give the market any comfort, especially as survey data continued to show signs of weakening.1
“That said, I’m encouraged by the evolution of tariff negotiations moving away from hyperbolic social media grenades to closed-door, bilateral discussions,” Orton said. Retail sales also remained strong in March despite nearly the lowest consumer sentiment levels on record. Earnings season has also been fine, with generally strong first-quarter results coupled with understandably guarded outlooks for the rest of 2025.
“Putting all of this together, my outlook is one of moderation, from tariffs to economic growth to earnings growth,” Orton said. “I expect to see tariff levels materially lower than what was announced on Liberation Day – but far above pre-inauguration levels – and to see tariff uncertainty gradually decline. It’s hard to say whether getting that moderation requires a retest of the lows in equities or more tumult in the U.S. Treasury market to force the administration’s hand. That’s why I believe diversification and selectivity are so important going forward. There appear to be potential opportunities across asset classes, geographies, and within sectors or industries following the big market moves this month, and I believe investors should start to consider slowly and selectively checking a few items off their shopping lists.”
Unusual times
U.S. Dollar Index and 10-year U.S. Treasury yields over the last year
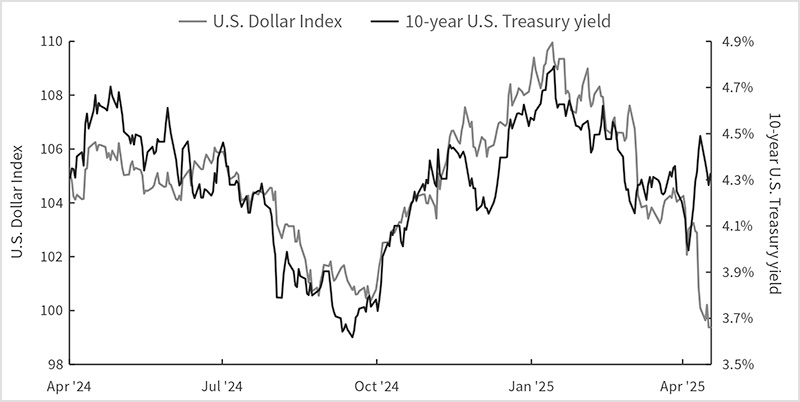
Source: Bloomberg, as of 4/17/25.
The most recent bout of uncertainty is focused on the Fed, including its perceived independence as well as hopes for the proverbial “Fed put” to come to the rescue of equity markets. Despite President Trump’s social media criticisms of Powell last week, Orton doesn’t believe there is a need to worry about Fed independence or Powell’s removal for now. U.S. Treasury Secretary Scott Bessent and National Economic Council Director Kevin Hassett remain vocally in favor of Fed independence, suggesting they feel little pressure from their boss to take a different view. Additionally, Powell maintains backing from Congress, which he made clear last week – something Orton doubts he would do unless that were true. The market response to Powell’s dismissal would also cause severe economic effects that would likely reverse the easing of financial conditions that Trump is seeking in the first place.
“I think it’s interesting to note that Trump’s social media attack on Powell came as the European Central Bank delivered on widely expected interest rate cuts and following Powell’s speech last Wednesday that read quite hawkish, especially relative to market expectations for nearly four rate cuts this year,” Orton said. “I still think there needs to be more of a reset in the Treasury market with respect to rate cut expectations before we start to see volatility come down sustainably and properly reflect the degree of economic uncertainty.”
One bright spot in the economy has been the consumer, despite abysmal sentiment. Retail sales jumped 1.4% month over month in March, ahead of expectations, buoyed by strong auto demand. While Orton said this was probably tariff front-running, there also was a big rebound in building materials sales as well as a healthy increase in food services sales, suggesting that the severe winter weather played a key role in holding back sales in January and February. The lower-end consumer remains under pressure, but there were serious and understandable concerns that the wealthier consumer would also be pulling back given a negative wealth effect from the market pullback and elevated uncertainty. But Orton said that’s not really what we’ve seen play out so far. A major credit card issuer reported good numbers and reaffirmed guidance, which makes a very strong statement about the spending expectations of its consumers. Earnings from some banks offered similar feedback. The health of the consumer overall is critical to keeping the economy out of recession, Orton said, and it seems that for all of the recent anguish about tariff-induced equity selloffs and plunging sentiment, the U.S. consumer remains in a decent place.
While the focus has understandably been at the macro level for most investors, Orton believes it’s important not to lose focus of what’s happening at the corporate level and in broader earnings trends. We’re entering the busiest few weeks of earnings season, and we’ll get the results from two of the Magnificent Seven this week, which could provide a harbinger of what’s to come. Financials have reported decent results over the past two weeks, highlighting the resilience of the consumer and offering a benign corporate outlook – if we can start to get some policy clarity in the near future. The S&P 500 Index’s blended earnings growth rate for the first quarter stands at 7.2%, right in line with consensus expectations, according to FactSet. There are concerns that earnings, and more critically guidance, could disappoint as we get into some of the more tariff-exposed sectors like information technology, industrials, and consumer discretionary. There are also concerns that full-year 2025 earnings expectations are still too high and that negative guidance could further pressure multiples. This could be key to the ultimate direction of the market, Orton said, and it’s too early to have a good sense of the downgrades that we might still need to make to earnings per share (EPS) growth estimates for 2025 and 2026.
“In this context, I believe selectivity is critical because higher-quality companies with more durability to the growth trends that drive earnings growth could continue to stand out in a persistently volatile environment,” Orton said. Accordingly, a few areas he is thinking about include:
Dividend growth. Dividend growers within the S&P 500 have meaningfully outperformed the broader market year to date, and this cohort of companies also appears to have provided some insulation from the recent tariff-driven volatility.
Secular growth beneficiaries. As economic growth inevitably slows, Orton said it’s even more important to consider leaning into long-term secular growth trends that are not derailed by all of the macro noise. As tech weakness continues, he believes indiscriminate selling could present some meaningful opportunities. The tariff carve-out for electronics could enable the sector to find some footing as we head into earnings season with a lot of negativity reflected in share prices. Software is Orton’s favored way to get exposure to the sector since it has stable or positive earnings revisions while profit margins are the highest across all sectors and could rise on a relative basis as other sectors are more impacted by tariffs. “There is certainly some cyclicality, but valuations have come down meaningfully, and I think this is an area where investors could look for long-term opportunities,” he said. There are also risks with semiconductor companies given that Trump has stated he will announce semiconductor tariff rates over the next week. And don’t forget about the significant investments that continue to take place along the artificial intelligence (AI) value chain. Orton believes the reduction in valuations following the DeepSeek and Liberation Day shocks more than reflects a proper economic slowdown across a number of industrial players that he sees as attractive now, even assuming near-term delays to some pipeline activities, which is not currently the case.
The importance of asset allocation. Orton worries about current U.S. policy and the challenges it presents to the closely linked current account, trade balance, and the U.S. government’s fiscal position. It has been coming to a head in Treasuries, and Powell has made it clear that the Fed can’t readily come to the rescue. As a result, Orton is looking at areas other than Treasuries for opportunities to help diversify asset allocations. These include U.S. Treasury Inflation-Protected Securities (TIPS), credit, municipal bonds, and gold. He believes municipal bonds in particular look attractive following meaningful underperformance. Yields are the most attractive in the past decade, and credit quality appears to be healthy. Orton also has been optimistic on gold as a diversifier over the past two months, and that remains the case now. He believes gold has – and could continue – to provide a hedge to equity losses as well as to the narrative regarding the debasement of the U.S. dollar. Concerns about U.S. policy toward the rest of the world and the near-term U.S. growth outlook could drive further central bank demand for gold. Gold historically tends to perform well during large equity corrections and could offer a cushion against a revival of stagflation concerns.
Orton expects news from the White House to continue to be the ultimate driver for the market for now. Meanwhile, more than 20% of S&P 500 companies are scheduled to report earnings this week. On the economic front, we get Institute for Supply Management Purchasing Managers’ Indexes (PMIs) in the United States, which should provide some insight into how firms are weathering the global trade war. In Europe, aside from the S&P Global Flash Composite PMIs, the week’s data highlights are the ifo Institute Business Climate Index for Germany and UK retail sales.
1 Unless otherwise indicated, all data cited is sourced from Bloomberg as of April 17, 2025.
Risk Information:
Investing involves risk, including risk of loss.
Diversification does not ensure a profit or guarantee against loss.
Disclosures:
Index or benchmark performance presented in this document does not reflect the deduction of advisory fees, transaction charges, or other expenses, which would reduce performance. Indexes are unmanaged. It is not possible to invest directly in an index. Any investor who attempts to mimic the performance of an index would incur fees and expenses that would reduce return.
This document is a general communication being provided for informational purposes only. It is educational in nature and not designed to be taken as advice or a recommendation for any specific investment product, strategy, plan feature, or other purpose in any jurisdiction, nor is it a commitment from Raymond James Investment Management or any of its affiliates to participate in any of the transactions mentioned herein. Any examples used are generic, hypothetical, and for illustration purposes only. This material does not contain sufficient information to support an investment decision, and you should not rely on it in evaluating the merits of investing in any securities or products. In addition, users should make an independent assessment of the legal, regulatory, tax, credit, and accounting implications and make their own determinations together with their own professionals in those fields. Any forecasts, figures, opinions, or investment techniques and strategies set out are for information purposes only, based on certain assumptions and current market conditions, and are subject to change without prior notice. All information presented herein is considered to be accurate at the time of production, but no warranty of accuracy is given and no liability in respect of any error or omission is accepted. It should be noted that investment involves risks, the value of investments and the income from them may fluctuate in accordance with market conditions and taxation agreements, and investors may not get back the full amount invested. Both past performance and yields are not reliable indicators of current and future results.
The views and opinions expressed are not necessarily those of the broker/ dealer or any affiliates. Nothing discussed or suggested should be construed as permission to supersede or circumvent any broker/dealer policies, procedures, rules, and guidelines.
There are risks associated with dividend investing, including that dividend-issuing companies may choose not to pay a dividend, may not have the ability to pay, or the dividend may be less than what is anticipated. Dividend-issuing companies are subject to interest rate risk and high dividends can sometimes signal that a company is in distress. Dividends are not guaranteed and must be authorized by the company’s board of directors.
Sector investments are companies engaged in business related to a specific sector. They are subject to fierce competition and their products and services may be subject to rapid obsolescence. There are additional risks associated with investing in an individual sector, including limited diversification.
Investing in small cap stocks generally involves greater risks, and therefore, may not be appropriate for every investor. The prices of small company stocks may be subject to more volatility than those of large company stocks.
International investing presents specific risks, such as currency fluctuations, differences in financial accounting standards, and potential political and economic instability. These risks are further accentuated in emerging market countries where risks can also include possible economic dependency on revenues from particular commodities or on international aid or development assistance, currency transfer restrictions, and liquidity risks related to lower trading volumes.
Commodity-linked investments may be more volatile and less liquid than the underlying instruments or measures, and their value may be affected by the performance of the overall commodities baskets as well as weather, disease, and regulatory developments.
Investing in bonds involves risks that may adversely affect the value of your investment such as inflation risk, credit risk, call risk, interest rate risk, and liquidity risk, among others. The two most prominent factors are interest rate movements and the credit worthiness of the bond issuer. Investors should pay careful attention to the types of fixed income securities that comprise their portfolios and remember that, as with all investments, there is the risk of loss of capital.
Definitions
The balance of trade, or trade balance, refers to the difference between the values of a nation’s imports and exports for a defined period of time.
Blended earnings combine actual results for companies that have reported earnings and estimated results for companies that have yet to report.
A consensus estimate is a forecast of a public company’s projected earnings, the results of a particular industry, sector, geography, asset class, or other category, or the expected findings of a macroeconomic report based on the combined estimates of analysts and other market observers that track the stock or data in question.
A correction is a decline in the market price of a security or index of more than 10% from its recent highs but not more than 20%.
Credit or credits are generic terms for fixed income securities such as corporate bonds, mortgage- or asset-backed securities, municipal bonds, or emerging market bonds.
The current account balance reflects a nation’s financial inflows and outflows. It is part of the balance of payments, which records all transactions between one nation and the rest of the world.
Cyclical stocks have prices influenced by macroeconomic changes in the economy and are known for following the economy as it cycles through expansion, peak, recession, and recovery.
Debasement as it relates to currencies refers to the lowering of value of a particular currency.
DeepSeek is a Chinese artificial intelligence startup that in January 2025 became a leading free downloadable app in the United States. This followed DeepSeek’s announcement that its AI model performed as well as market-leading models and that it was developed at a significantly lower cost. This led to a selloff of well-known U.S. technology stocks on Jan. 27, 2025.
Dividend growers are companies that have followed a policy of consistently increasing dividends every year over a period of years.
Dividend payers are the companies that distribute a portion of their profits to shareholders in the form of a dividend.
Earnings per share (EPS) is calculated as a company’s profit divided by the outstanding shares of its common stock. The resulting number serves as an indicator of a company’s profitability.
“Fed put” is an adaption of the option term “put,” and it describes the belief among market participants that the U.S. Federal Reserve would step in and implement policies to limit the equity market’s decline beyond a certain point.
Fiscal policy refers to the tax collection and spending a government uses to influence its country’s economy.
The fiscal position of a government refers to the total of its revenues, spending and debt levels and can also refer to how these factors influence the national economy.
Front-running is trading any financial asset or buying goods or services based on knowledge of a future transaction or development that will substantially affect the price in question.
Guidance refers to statements from the managers of publicly traded companies that indicate whether they expect to realize near-term profits or losses and why.
Hawkish, dovish, and centrist are terms used to describe the monetary policy preferences of central bankers and others. Hawks prioritize controlling inflation and may favor raising interest rates to reduce it or keep it in check. Doves tend to support maintaining lower interest rates, often in support of stimulating job growth and the economy more generally. Centrists tend to occupy the middle of the continuum between tight (hawkish) and loose (dovish) monetary policy.
Hedge is an investment or investment strategy that is designed to lessen the potential for losses in other investments. The price of an investment considered to be a hedge often moves in the opposite direction of the prices of the investments being hedged.
The ifo Institute Business Climate Index for Germany is based on a monthly survey of about 9,000 firms in manufacturing, the services sector, and construction, plus wholesale and retail sales about their characterization of their current business and their expectations for the next six months. It is published by the ifo Institute for Economic Research, based in Munich.
The Institute for Supply Management produces several surveys assessing business conditions and outlooks across a variety of industries. They include the ISM Purchasing Managers’ Index (PMI), which measures the prevailing direction of economic trends in the manufacturing sector, and the Services ISM® Report on Business®, which is based on data compiled from purchasing and supply executives and reflects the change, if any, in the current month compared to the previous month in supplier deliveries along with seasonally adjusted business activity, new orders, and employment.
Liberation Day is a term used by President Donald Trump to refer to April 2, 2025, when he announced a wide range of unexpectedly high tariffs on many U.S. trading partners, triggering a global selloff of risk assets.
The Magnificent Seven refers to the seven largest stocks by market capitalization in the S&P 500 Index, as of Dec. 31, 2024. Collectively they made up more than 25% of the market capitalization of the entire index. They are Alphabet, Amazon.com, Apple, Meta Platforms, Microsoft, NVIDIA and Tesla.
A multiple, sometimes referred to as the price multiple or earnings multiple, is a measure of a company’s value based on the ratio of its current share price to its earnings per share. This ratio is known as the price-to-earnings ratio, or P/E.
A pullback is a temporary pause or drop in the price of a security that previously had been rising.
S&P Global Flash Composite Purchasing Managers’ IndexTM (PMI) surveys are produced by S&P Global. The flash estimate is based on around 85% of total PMI survey responses each month and is designed to provide an accurate advance indication of the final PMI data for a particular country or region.
Secular trends are large-scale and ongoing changes in economies and societies that have the potential to drive broad and lasting economic, technological, social or other kinds of changes.
Stagflation, first described after the oil shocks of the 1970s, is an economic condition that includes slow economic growth (or even declines in gross domestic product), relatively high unemployment, and inflation.
A tariff carve-out is an exception to a tariff policy that otherwise would apply to a particular country, industry, company, or type of goods.
U.S. Treasury Inflation-Protected Securities (TIPS) provide protection against inflation. The principal of a TIPS instrument increases with inflation and decreases with deflation, as measured by the Consumer Price Index. When a TIPS matures, investors are paid the adjusted principal or original principal, whichever is greater.
The wealth effect refers to a theory of behavioral economics that holds that people often feel comfortable spending more as the value of their household assets, including their homes and investment portfolios, rises. Conversely, a negative wealth effect refers to a hesitation to spend as the value of household assets fall.
Indices
The S&P 500 Index measures changes in stock market conditions based on the average performance of 500 widely held common stocks. It is a market-weighted index calculated on a total return basis with dividend reinvested. The S&P 500 represents approximately 80% of the investable U.S. equity market.
The U.S. Dollar Index is a measure of the value of the U.S. dollar relative to the value of a basket of currencies from most of the U.S.’s most significant trading partners.
M-726994 Exp. 8/21/2025
Until there is more clarity on tariffs, equity markets remain vulnerable to decisions driven by uncertainty, apprehension, and risk deleveraging.
Fixed income and currency markets likewise remain problematic and continue to highlight the high level of uncertainty.
In this environment, Matt Orton, CFA, believes it’s important for equity investors to take a step back and remain focused on earnings growth.
The market’s visceral reaction to President Trump’s “Liberation Day” tariffs finally forced cooler heads to prevail, but it’s too early to say that we’re out of the woods.
“I said last week that the market will not find footing until Trump blinks, and that’s exactly what happened on Wednesday,” said Matt Orton, CFA, Chief Market Strategist at Raymond James Investment Management. “The tariff delays and carveouts have provided much-needed relief for investors and removed some of the worst left-tail scenarios from the table, but there are still a lot of unknowns.”
We lack clarity with respect to the administration’s endgame, including the next phase of tariffs on pharmaceuticals and semiconductors. We also lack clarity on the short- and long-term impacts of tariff policy on corporate earnings both in the United States and globally.1 And until we get additional clarity, Orton said, markets will remain prone to (dis-)investment decisions driven by uncertainty, apprehension, and risk deleveraging.
That, however, doesn’t meant there aren’t potential opportunities for investors right now, Orton said. Many high-quality companies with leverage to long-term secular growth trends and lower exposure to Chinese supply chains have been thrown out with the bathwater, he said. As earnings season ramps up, he said investors could start to consider whether to slowly and selectively check a few items off their shopping lists. Along the way, he favors being mindful that the bottoming process will take time and is a bumpy road, especially as the extent to which the economy and sentiment have been impaired becomes more clear. But that damage is likely not universal, which he believes creates potential opportunities where long-term investors could work to unlock value.
“The biggest unknown right now is China, particularly when we start to see some progress on negotiations,” Orton said. “While we got relief from reciprocal tariffs, the effective tariff rate for the United States actually rose to over 27% – from 22% last week – due to the crazy 145% tariff rate on China. My base case is that the White House quickly moderates its tariff policy on China in coming weeks to avoid some of the most negative outcomes with respect to growth and inflation.”
The importance of progress is particularly important given how long-term inflation expectations continue to move further from the target of the U.S. Federal Reserve (Fed). Last week, we saw the University of Michigan Index of Consumer Sentiment’s five-year inflation expectations jump again, to 4.4%, their highest level since 1991. This is concerning since the data comes before tariff-related inflation has significantly appeared in U.S. consumer prices, suggesting considerable upside risk going forward, Orton said. Households appear to have come to the same conclusion as markets: The tariffs will do lasting damage to the U.S. economy.
Inflation expectations continue to sour consumer sentiment
University of Michigan Index of Consumer Sentiment data since 2020
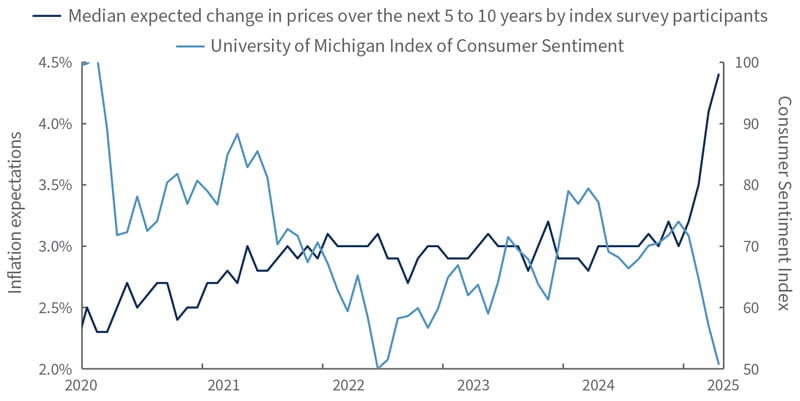
Source: Bloomberg, as of 4/11/25.
Although the good news in equities helped to assuage some of the worst investor fears, the fixed income and currency markets remain more problematic and continue to highlight the high level of uncertainty, Orton said. In fact, there are some early signs of cracks in the U.S. Treasury market, specifically:
A substantial decrease in U.S. swap spreads across the curve,
A tailed 3-year auction – that is, one where the final auction yield is higher than the yield expected in the secondary market – at a time when more Fed cuts were nonetheless getting priced in, and
Evidence of speedy deleveraging in the bond basis trade and substantial repricing of the U.S. term premium for longer-term Treasury bonds.
In this environment, 10-year U.S. Treasury yields surged 50 basis points from their lows on April 4 – all while the dollar has continued to weaken.
“It’s clear that the perception of U.S. Treasuries has taken a hit, and I believe that right now it’s not worth taking risks by adding duration in fixed income,” Orton said. “Instead, I would consider looking to inflation-protected bonds or parts of the market where there are clear dislocations like municipals.”
“With all of the uncertainty, I think it’s important that we take a step back and get back to the one thing that ultimately matters for the equity market – earnings growth,” Orton said. And he noted that the first-quarter earnings season kicked off with the big banks reporting strong results, providing useful context around the state of business and the consumer.
“We’re coming from a place of strength as we head into whatever you want to call this self-imposed state of purgatory,” Orton said. Bank bosses might be adding to credit reserves, but that was a given with macroeconomic uncertainty so high. Customer activity may have stalled, but pipelines remain strong with uncertainty the hurdle to realizing backlogs.
“I suspect this will be the case as we go through earnings season: Many projects across sectors and industries are on hold, but not cancelled,” he said. “The ultimate damage will depend on how long it takes to clear the policy fog. Recession is not my base case right now unless we start to see business investment permanently deteriorate.”
While Orton’s longer-term outlook might be somewhat more constructive than the prevailing market narrative, he said, “I want to be very explicit on emphasizing the heightened level of risk and the importance of being very selective in putting money to work.” He believes there are some attractive opportunities, but that doesn’t mean they can’t continue to fall if we can’t get on a path to some sort of normalcy. He believes investors should still consider looking for ways to diversify their portfolios to help cushion the inevitable bumps in a prolonged bottoming process. Themes and areas he’s looking at both to help mitigate risk to portfolios and to be opportunistic include:
This is not the time to leave. While uncertainty remains incredibly elevated, Orton’s key message is stay the course. The moves over the past two weeks have been historic and have included multiple-standard deviation events nearly every day. If you left the market after April 2, then you missed the significant bounce on April 9. Historically, the biggest up-moves in the S&P 500 Index in recent decades occurred during large market shocks. Since 1990, the S&P 500 has had 12 days with gains of 6% or more, all of which were realized during the Global Financial Crisis and the COVID-19 pandemic. However, these positive jumps were only sustainable after there was a clear and powerful policy response, which Orton suggests we’ve only “kind of” had. Volatility isn’t going away until there is policy clarity, but there are signs of life across the U.S. and international markets, he said: “It’s all about being able to make tactical adjustments.”
Gold and gold miners. Gold has been on an impressive run over the past few years. 2024 was another year of heavy central bank buying of the metal, and purchases accelerated in the fourth quarter with China being one of the biggest official buyers. The precious metal is up over 20% year to date, and it has provided a hedge to equity losses, even when Treasuries sharply turned. Concerns about U.S. policy toward the rest of the world and the near-term U.S. growth outlook could drive further central bank demand for gold. It also tends to outperform during large equity market corrections and could offer a buffer against a revival of stagflation concerns. Orton has advocated for considering adding exposure to gold miners on the weakness following Liberation Day, and we saw a huge rally last week. “I wouldn’t chase here,” he said, “but I would consider adding to positions on further weakness given that the miners are still underperforming their historical beta to the commodity. I also believe earnings should be good for the group.”
Artificial intelligence (AI) and technology. Tech was already correcting before the pain from Liberation Day, but the selling became indiscriminate, and Orton believes that has created potential opportunities. The tariff carveout for electronics could help the sector find some footing as we head into earnings season with a of negativity reflected in share prices. Software is Orton’s favored way to get exposure to the sector since it has had stable or positive earnings revisions while profit margins are the highest across all sectors and could rise on a relative basis as tariffs have a bigger impact on other sectors. There is certainly some cyclicality to software, but valuations have come down meaningfully and he believes this is an area investors could consider for long-term opportunities. There are also risks with semiconductors given that President Trump has stated he will announce semiconductor tariff rates over the next week. Also, don’t forget about the significant investments that continue to take place along the AI value chain. The reduction in valuations following the news of the DeepSeek AI model and the chaos triggered by Liberation Day more than reflects a proper economic slowdown across a number of the industrial players that still look attractive, Orton said, even assuming some near-term delays to projects in the pipeline, which he said is not the case now.
Offsets around the world. In the United States, there have been places to hide like healthcare, specifically health maintenance organizations. They were beat up heading into this year, and Orton said they remain attractive given dividend growth characteristics as well as earnings that are largely out of the fray from tariff concerns. Additionally, he believes the aerospace and defense industry has some interesting opportunities after the big moves recently. He noted that Ferguson’s Law states: “Any great power that spends more on debt servicing than on defense risks ceasing to be a great power.” Last year marked the first year the United States spent more on debt service than it did on defense, and there are clearly attempts from the current administration to reverse both. Overseas, European defense companies have been winners year to date, but Orton believes the recent pullback could offer a selective entry amid the European Union’s ReArm Europe Plan. Orton also believes markets are on the cusp of a fundamental shift in defense positioning given the structural underweights that investment funds tend to exhibit in defense stocks due to environmental, social, and governance concerns that are being reconsidered. In emerging markets, he said India also could offer an offset to tariff concerns. Exports to the United States are only about 2% of India’s gross domestic product (GDP), and the economy is largely driven by domestic consumption. Also, India’s fiscal position is strong, and Prime Minister Narendra Modi is willing to negotiate. Indian equities look interesting given a more domestically focused economy and more attractive valuations following a 15% pullback over the past six months, Orton said.
Although earnings season heats up this week, tariffs and geopolitics will remain the main focus for investors. Iran is back at the table with the United States for nuclear negotiations for the first time in years, Japan will hold discussions with Washington on trade, and Italian Prime Minister Giorgia Meloni also meets with President Trump on trade. Economic data due this week includes Chinese GDP, U.S. retail sales, as well as consumer price index reports from the U.K. and Japan.
1 Unless otherwise indicated, all data cited is sourced from Bloomberg as of April 11, 2025.
Risk Information:
Investing involves risk, including risk of loss.
Diversification does not ensure a profit or guarantee against loss.
Disclosures:
Index or benchmark performance presented in this document does not reflect the deduction of advisory fees, transaction charges, or other expenses, which would reduce performance. Indexes are unmanaged. It is not possible to invest directly in an index. Any investor who attempts to mimic the performance of an index would incur fees and expenses that would reduce return.
This document is a general communication being provided for informational purposes only. It is educational in nature and not designed to be taken as advice or a recommendation for any specific investment product, strategy, plan feature, or other purpose in any jurisdiction, nor is it a commitment from Raymond James Investment Management or any of its affiliates to participate in any of the transactions mentioned herein. Any examples used are generic, hypothetical, and for illustration purposes only. This material does not contain sufficient information to support an investment decision, and you should not rely on it in evaluating the merits of investing in any securities or products. In addition, users should make an independent assessment of the legal, regulatory, tax, credit, and accounting implications and make their own determinations together with their own professionals in those fields. Any forecasts, figures, opinions, or investment techniques and strategies set out are for information purposes only, based on certain assumptions and current market conditions, and are subject to change without prior notice. All information presented herein is considered to be accurate at the time of production, but no warranty of accuracy is given and no liability in respect of any error or omission is accepted. It should be noted that investment involves risks, the value of investments and the income from them may fluctuate in accordance with market conditions and taxation agreements, and investors may not get back the full amount invested. Both past performance and yields are not reliable indicators of current and future results.
The views and opinions expressed are not necessarily those of the broker/dealer or any affiliates. Nothing discussed or suggested should be construed as permission to supersede or circumvent any broker/dealer policies, procedures, rules, and guidelines.
There are risks associated with dividend investing, including that dividend-issuing companies may choose not to pay a dividend, may not have the ability to pay, or the dividend may be less than what is anticipated. Dividend-issuing companies are subject to interest rate risk and high dividends can sometimes signal that a company is in distress. Dividends are not guaranteed and must be authorized by the company’s board of directors.
Sector investments are companies engaged in business related to a specific sector. They are subject to fierce competition and their products and services may be subject to rapid obsolescence. There are additional risks associated with investing in an individual sector, including limited diversification.
Investing in small cap stocks generally involves greater risks, and therefore, may not be appropriate for every investor. The prices of small company stocks may be subject to more volatility than those of large company stocks.
International investing presents specific risks, such as currency fluctuations, differences in financial accounting standards, and potential political and economic instability. These risks are further accentuated in emerging market countries where risks can also include possible economic dependency on revenues from particular commodities or on international aid or development assistance, currency transfer restrictions, and liquidity risks related to lower trading volumes.
Commodity-linked investments may be more volatile and less liquid than the underlying instruments or measures, and their value may be affected by the performance of the overall commodities baskets as well as weather, disease, and regulatory developments.
Investing in bonds involves risks that may adversely affect the value of your investment such as inflation risk, credit risk, call risk, interest rate risk, and liquidity risk, among others. The two most prominent factors are interest rate movements and the credit worthiness of the bond issuer. Investors should pay careful attention to the types of fixed income securities that comprise their portfolios and remember that, as with all investments, there is the risk of loss of capital.
Definitions
Auction yield refers to the annual yield investors can expect from holding a U.S. Treasury security, as determined by an auction of government securities to primary dealers who make bids specifying a minimum yield.
Basis points (bps) are measurements used in discussions of interest rates and other percentages in finance. One basis point is equal to 1/100th of 1%, or 0.01%.
A basis trade refers to a strategy used by hedge funds capitalize on the difference in price between the prices of U.S. Treasury bonds and the hedge funds’ futures contracts. The trades often use high levels of leverage, and when the trade unwinds, it can fuel volatility and cause price elevations in the market.
Beta is a measure of the volatility or systemic risk of a security, group of securities, or portfolio compared with another security, group of securities, portfolio, or the market as a whole.
Capital expenditures, or capex, are monies used by a company to buy, improve, or maintain physical assets such as real estate, facilities, technology, or equipment, and may include new projects or investments.
China’s gross domestic product, measured by the National Bureau of Statistics of China, summarizes the nation’s total quarterly economic output across a range of industries, including manufacturing, agriculture, construction, wholesale and retail trade, transportation, finance, hotel and catering services, real estate, business services, information technology, and other economic activities.
A correction is a decline in the market price of a security or index of more than 10% from its recent highs but not more than 20%.
Cyclical stocks have prices influenced by macroeconomic changes in the economy and are known for following the economy as it cycles through expansion, peak, recession, and recovery.
DeepSeek is a Chinese artificial intelligence startup that in January 2025 became a leading free downloadable app in the United States. This followed DeepSeek’s announcement that its AI model performed as well as market-leading models and that it was developed at a significantly lower cost. This led to a selloff of well-known U.S. technology stocks on Jan. 27, 2025.
Deleveraging risk refers to efforts my market participants to reduce their exposure to risks that may be fluctuating in capital markets.
Dividend payers are the companies that distribute a portion of their profits to shareholders in the form of a dividend.
Dividend growers are companies that have followed a policy of consistently increasing dividends every year over a period of years.
Duration incorporates a bond’s yield, coupon, final maturity, and call features into one number, expressed in years, that indicates how price-sensitive a bond or portfolio is to changes in interest rates. Bonds with higher durations carry more risk and have higher price volatility than bonds with lower durations.
Ferguson’s Law holds that “any great power that spends more on debt servicing than on defense risks ceasing to be a great power.” The idea was proposed Feb. 21, 2025 in a history working paper by Niall Ferguson, Milbank Family Senior Fellow at the Hoover Institution at Stanford University.
Fiscal policy refers to the tax collection and spending a government uses to influence its country’s economy.
A futures contract is a legal agreement to buy or sell an asset at a predetermined price at a specified time in the future, which is known as the expiration date. Futures contracts are financial derivatives that allow investors to speculate on the direction of a particular asset and are often used to hedge the price movement of the underlying asset to help prevent losses from undesired price changes.
Gross domestic product (GDP) is the total value of goods and services provided in an economy during a specified period, often one quarter or one year.
A hedge is an investment or investment strategy that is designed to lessen the potential for losses in other investments. The price of an investment considered to be a hedge often moves in the opposite direction of the prices of the investments being hedged.
The inflation target of the U.S. Federal Reserve is the rate of price increases that the Fed prefers to see to ensure the economy will remain stable. Generally, the Fed’s target rate is 2%, as measured by the Personal Consumption Expenditures (PCE) Price Index.
The Japan Consumer Price Index (CPI), released monthly by the Statistics Bureau of Japan, tracks core inflation by monitoring price changes in a wide variety of goods and services, excluding fresh foods but including energy, purchased by households nationwide.
Leverage investing refers to the use of debt to enhance returns from an investment.
Liberation Day is a term used by President Donald Trump to refer to April 2, 2025, when he announced a wide range of unexpectedly high tariffs on many U.S. trading partners, triggering a global selloff of risk assets.
Positioning refers to assessments of whether professional investors are, on the whole, bullish or bearish on a particular security, industry, sector, market capitalization or other area of the market, as reflected by the extent to which they are invested in the area of the market in question.
A pullback is a temporary pause or drop in the price of a security that previously had been rising.
The ReArm Europe Plan/Readiness 2030 plan includes legal and financial means to support the defense investments of member states of the European Union and to increase defense capabilities of member states quickly and significantly.
A reciprocal tariff is a tax or trade restriction that one nation imposes on another on a tit-for-tat basis in response to a trade-restriction actions taken by the nation that is the subject of the reciprocal tariff.
The Retail Sales Report is a monthly U.S. Census Bureau report that seeks to provide current estimates of sales at retail and food services stories and inventories held by retail stores, based on a survey of about 13,000 retail businesses, supplemented by estimates for other employers.
Secular trends are large-scale and ongoing changes in economies and societies that have the potential to drive broad and lasting economic, technological, social or other kinds of changes.
Stagflation, first described after the oil shocks of the 1970s, is an economic condition that includes slow economic growth (or even declines in gross domestic product), relatively high unemployment, and inflation.
Standard deviation is a measure of the dispersal or uncertainty in a random variable. For example, if a financial variable is highly volatile, it has a high standard deviation. Standard deviation is frequently used as a measure of the volatility of a random financial variable.
Sustainable investing refers to Environmental, Social, and Governance factors used in measuring the sustainability and societal impact of an investment in a company or business. A sustainable investment strategy will include only holdings deemed consistent with those applicable guidelines. As a result, the universe of investments available to the strategy will be more limited than strategies not applying such guidelines.
Swaps markets is a term for the over-the-counter market between private parties (usually firms and financial institutions) to trade in swaps, which are customized contracts between two parties to exchange sequences of cash flows (as from forward contracts or bonds) for a set period of time.
A swap spreads curve reflects the relationship between swap rates at different maturities in a way that’s similar to how a yield curve reflects different yields of bonds with the same credit quality and different maturities. A swap spread reflect the difference between swap rates and U.S. Treasury yield.
A tailed U.S. Treasury auction is one where the auction’s final yield is different than the yield that had been expected in the secondary market before the auction. A positive tail reflects a final auction yield that was higher than had been expected.
Tail risk describes a form of portfolio risk associated with the increased possibility that an investment will move more than three standard deviations from the mean in a normal distribution. Left tail risks refer to unusually large losses. Right tail risks refer to unusually large gains.
A term premium is the compensation that investors in U.S. Treasury bonds require for bearing the risk that interest rates may change over the life of the bond, particularly longer-term Treasuries.
U.S. Treasury Inflation-Protected Securities (TIPS) provide protection against inflation. The principal of a TIPS instrument increases with inflation and decreases with deflation, as measured by the Consumer Price Index. When a TIPS matures, investors are paid the adjusted principal or original principal, whichever is greater.
The U.K. Consumer Prices Index is a measure of consumer price inflation in the United Kingdom based a wide range of household spending, including on food, alcoholic beverages and tobacco, clothing and shoes, housing and utilities, health, transportation, communication, recreation, education, restaurants and hotels, and miscellaneous goods and services.
The University of Michigan Index of Consumer Sentiment is based on monthly telephone surveys in which at least 500 consumers in the continental United States are asked 50 questions about what they think now and what their expectations are for their personal finances, business conditions, and buying conditions. Their responses are used to calculate monthly measures of consumer sentiment that can be compared to a base value of 100 set in 1966.
Unwinding describes the process of closing out what is often a large or complicated trading position.
Indices
The S&P 500 Index measures changes in stock market conditions based on the average performance of 500 widely held common stocks. It is a market-weighted index calculated on a total return basis with dividend reinvested. The S&P 500 represents approximately 80% of the investable U.S. equity market.
M-721922 Exp. 8/14/2025
Last week’s tariff-induced selloff was a seven-standard deviation event and left the market oversold across a number of metrics.
Historically, while the S&P 500 Index has seen up-days following past market shocks, those positive moves were only sustainable after policy-makers delivered a clear and powerful policy response.
While uncertainty likely will remain high for some time, Matt Orton, CFA, believes there are still potential diversification opportunities for investors to consider.
Quite a lot has changed. And quite a lot remains uncertain as we move into uncharted territory on geopolitics and global trade.
Fundamentals were thrown out the window and cross-asset volatility spiked to levels not seen since the early days of the COVID-19 pandemic in response to President Donald Trump’s tariff announcements on April 2. The S&P 500 Index’s two-day crash brought the index down more than 10%, was a seven-standard deviation event, and left the market oversold across a number of metrics.1
“We’re due for a breather as cooler heads strategize next steps with respect to retaliation or negotiation, but it’s the growing list of unknowns that keep me skeptical of bounces we might see in the near term,” said Matt Orton, CFA, Chief Market Strategist at Raymond James Investment Management.
Orton noted that the biggest up-moves in the S&P 500 historically have occurred during large market shocks. Since 1990, the S&P 500 has had 12 6% up-days, all of which took place during the Global Financial Crisis and COVID pandemic. However, these positive jumps were only sustainable after there was a clear and powerful policy response.
So who will blink? President Trump or U.S. Federal Reserve Chair Jerome Powell? That’s where the market remains incredibly split and is what investors will try to figure out in the near future.
“The cure for lower prices is often lower prices, we just don’t know how low they need to go and what level of chaos must be endured,” Orton said. “My key theme heading into this year has focused on increasing portfolio diversification, and that has provided some amount of stabilization from the broader pain across the market. There have been many potential opportunities created as the proverbial baby has been thrown out with the bathwater, but I would resist the urge to buy the dip and continue to look for opportunities to diversify.”
Index drawdowns since 2018
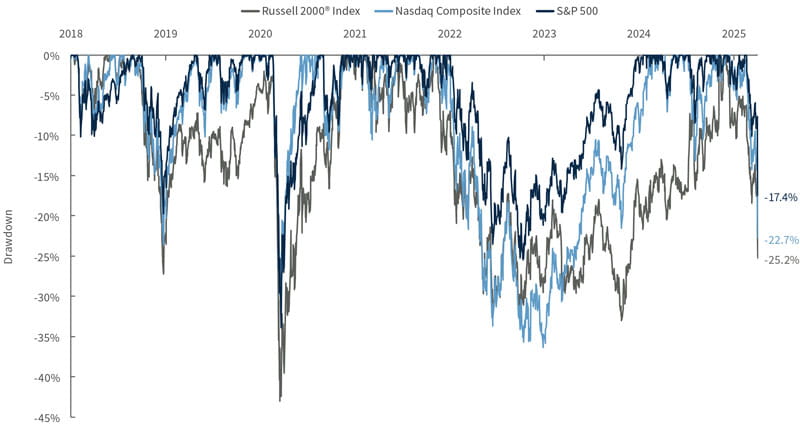
Source: Bloomberg, as of 4/4/25.
The only thing anyone knows is that the current state of tariffs will look very different from where policy eventually stabilizes, Orton said. While many expect the current tariff rates to creep lower after trade negotiations, it may be premature to treat the announced levies as the peak. Trump presented the tariff rates as already “discounted” and U.S. Commerce Secretary Howard Lutnick noted that “the tariffs can go up if a country retaliates,” which China has already done.
Also, he believes the most concerning part of the announcements last week was that tariff rates were based on trade deficits in goods, as opposed to differentials in tariff rates (the common understanding of “reciprocal” tariffs). This suggests a much more drawn-out process rather than simply negotiating down tariff rates charged by other countries.
“There’s no way around this being stagflationary for the U.S. economy, which is thankfully coming from a place of strength,” Orton said. Unfortunately, he added that this outcome injects more uncertainty into the path of the Federal Reserve (Fed), which has to manage around the competing interests of growth and inflation. The interest rates market is clearly worried more about “stag” and less about “flation” with nearly four interest rate cuts priced in for this year. This is not a good environment for the Fed’s data-dependent approach, and Powell will have to be more forward-looking and conscious of the likely damage to growth. At this point, Orton said, more rate cuts are the likely outcome.
In the meantime, Orton noted that “markets always respond first and sort out the details later.” There will be ongoing sources of feedback, between asset prices and the real economy (and vice versa), between the administration and the markets, between the Fed and the markets, and between the Fed and the data (and vice versa). But he said these sources of feedback could seize up when liquidity disappears. Panic unwinds of passive vehicles can exacerbate moves across individual stocks; the explosion of levered exchange-traded funds (ETFs) can both suppress volatility and exacerbate it, like we’re seeing now; and the growth of short-dated options can further disrupt the liquidity on which the market has come to rely. The Chicago Board Options Exchange (CBOE) recently noted that 47% of all options traded in 2024 had expirations between 0 and 5 days to expiration, highlighting just how important these vehicles have become to the operating environment of the market.
“These idiosyncrasies are very important to the volatility and liquidity environment in which we find ourselves, and they can exacerbate moves in both directions,” Orton said. “This is yet another reason why I believe it’s so important not to overact in either direction and to remain lighter on risk until we can fully appreciate where the fundamentals will go.”
It might sound hollow to say, “this too shall pass,” but it will, Orton said. The question is when, and how much lower the base upon which we’ll build the next market rally will be. It’s too early to answer that question, which is why he believes it doesn’t make sense to chase any market bounces until we see an actual policy pivot. We also need to better understand how the April 2 tariffs have impacted the thinking across corporate America, he said. Generally, earnings season provides additional clarity around management execution as well as expectations around the operating environment going forward. Unfortunately, Orton doesn’t expect very much clarity as first-quarter earnings season kicks off this week. Earnings will help provide a snapshot of which companies were in a good spot prior to the tariff announcements, but he said it’s too soon to expect any clarity with respect to capital expenditures, workforce changes, or the actual impact on customer buying behavior. Nonetheless, he said it will be informative to see where only marginal changes are made to guidance versus where guidance is slashed or pulled altogether. While uncertainty will remain high for some time, he believes there are still some opportunities for investors to consider, either to help insulate their portfolios from further tariff damage or to start nibbling at should we see a policy pivot. They include:
Leaning into diversification. Orton has encouraged clients to consider leaning into diversification — across asset classes, sectors, industries, and geographies — since the start of the year. This could include adding duration though high-quality fixed income, which has usually provided a measure of downside risk mitigation given the correlation between stocks and bonds as markets have struggled for the past few months. While rates have moved meaningfully, he believes there are still opportunities to think about leaning into fixed income now given that rates are biased to move lower in a growth scare environment. Orton also favors gold as a potential source of diversification, noting that it tends to perform well in classic risk-off situations when stocks and interest rates fall together amid growth concerns. Since 2008, there have been 39 days when the S&P 500 was down 4% or more days. Gold’s average return on those days was 30 basis points. Its correlation to the S&P 500 on those days was just 22%. It’s unrelated to the S&P 500 when you need it to be, he said, except during a true market liquidation when both the stock and bond market crash together. From a tactical perspective, he said Friday’s selloff in gold miners looks interesting.
Weak dollar plays and rate-sensitive sectors. The dollar has not been a safe haven through the recent selloff given worries about the resilience of U.S. growth and the potential for Fed cuts. Instead, Orton said he would consider looking for portfolio diversifiers in trades that lean into continued dollar weakness — and Latin America fits the bill. Combine what are relatively lower tariffs for countries there with a fading U.S. exceptionalism narrative and there’s a case to think about for Latin American markets, he said. Brazil in particular has economic conditions Orton believes are worth thinking about. He noted that only about 1% of Bovespa Index revenues come from exports to the United States, and a stronger Brazilian real could help anchor inflation expectations, which could lead to confidence in rate cuts later this year, a potential positive for markets. In the United States, he said he would consider rate-sensitive sectors like utilities as a possible cushion given their domestic revenue exposure, sensitivity to commodity prices (which are lower), and durable trends for increasing demand.
Hedges and offsets. There are few interesting areas investors can consider to help offset the negative risk-off impact from tariffs, Orton said. He favors considering Indian equities given the country’s more domestically focused economy and more attractive valuations following a 15% pullback over the past six months. In particular, Indian banks stand out as largely levered to the Indian growth story and domestic investment with minimal tariff read-throughs. Lower commodity prices also could benefit local manufacturing and infrastructure development. In the United States, discount retailers also could provide some differentiation now — they buy and sell excess inventory from higher-end shops at lower prices — and they benefit from trading down or bargain hunting. Their ability to retain some pricing power on purchase price and the end price to their consumer could help insulate against inflation from tariffs.
In summary, Orton believes investors should think about avoiding sectors and industries with large exposure to international revenues and supply chains, which do include some otherwise defensive sectors. He favors domestic defensives, dividend growers, and differentiated industry groups that are less vulnerable to trade tensions, like discount retailers and gold miners, as well as countries like India or Brazil that could benefit on a relative basis.
This week’s focus will be on any additional fallout from or further updates to President Trump’s trade policy. On the economic front, the U.S. Consumer Price Index comes out Thursday. Friday brings the Producer Price Index and University of Michigan Index of Consumer Sentiment. The minutes from the March meeting of the Federal Open Market Committee also will be released, but those are stale at this point. Markets instead will focus on the handful of Fed officials scheduled to speak this week.
Earnings season also kicks off at the end of the week, starting with the big banks. Results will still be important to get a sense for the health of the consumer heading into the new tariff regime, but guidance will be the focus to get corporate executives’ initial thoughts on the potential impact going forward.
1 Unless otherwise indicated, all data cited is sourced from Bloomberg as of April 4, 2025.
Risk Information:
Investing involves risk, including risk of loss.
Diversification does not ensure a profit or guarantee against loss.
Disclosures:
Index or benchmark performance presented in this document does not reflect the deduction of advisory fees, transaction charges, or other expenses, which would reduce performance. Indexes are unmanaged. It is not possible to invest directly in an index. Any investor who attempts to mimic the performance of an index would incur fees and expenses that would reduce return.
This document is a general communication being provided for informational purposes only. It is educational in nature and not designed to be taken as advice or a recommendation for any specific investment product, strategy, plan feature, or other purpose in any jurisdiction, nor is it a commitment from Raymond James Investment Management or any of its affiliates to participate in any of the transactions mentioned herein. Any examples used are generic, hypothetical, and for illustration purposes only. This material does not contain sufficient information to support an investment decision, and you should not rely on it in evaluating the merits of investing in any securities or products. In addition, users should make an independent assessment of the legal, regulatory, tax, credit, and accounting implications and make their own determinations together with their own professionals in those fields. Any forecasts, figures, opinions, or investment techniques and strategies set out are for information purposes only, based on certain assumptions and current market conditions, and are subject to change without prior notice. All information presented herein is considered to be accurate at the time of production, but no warranty of accuracy is given and no liability in respect of any error or omission is accepted. It should be noted that investment involves risks, the value of investments and the income from them may fluctuate in accordance with market conditions and taxation agreements, and investors may not get back the full amount invested. Both past performance and yields are not reliable indicators of current and future results.
The views and opinions expressed are not necessarily those of the broker/dealer or any affiliates. Nothing discussed or suggested should be construed as permission to supersede or circumvent any broker/dealer policies, procedures, rules, and guidelines.
There are risks associated with dividend investing, including that dividend-issuing companies may choose not to pay a dividend, may not have the ability to pay, or the dividend may be less than what is anticipated. Dividend-issuing companies are subject to interest rate risk and high dividends can sometimes signal that a company is in distress. Dividends are not guaranteed and must be authorized by the company’s board of directors.
Sector investments are companies engaged in business related to a specific sector. They are subject to fierce competition and their products and services may be subject to rapid obsolescence. There are additional risks associated with investing in an individual sector, including limited diversification.
Investing in small cap stocks generally involves greater risks, and therefore, may not be appropriate for every investor. The prices of small company stocks may be subject to more volatility than those of large company stocks.
International investing presents specific risks, such as currency fluctuations, differences in financial accounting standards, and potential political and economic instability. These risks are further accentuated in emerging market countries where risks can also include possible economic dependency on revenues from particular commodities or on international aid or development assistance, currency transfer restrictions, and liquidity risks related to lower trading volumes.
Commodity-linked investments may be more volatile and less liquid than the underlying instruments or measures, and their value may be affected by the performance of the overall commodities baskets as well as weather, disease, and regulatory developments.
Definitions
American or U.S. exceptionalism is an idea centered on the notion that the United States is a unique and even superior nation as a result of historical, ideological, religious, and/or, in the context of finance, economic reasons. Proponents of American exceptionalism often expect or advocate for the United States to occupy or play a leading role in global affairs.
Basis points (bps) are measurements used in discussions of interest rates and other percentages in finance. One basis point is equal to 1/100th of 1%, or 0.01%.
The Chicago Board Options Exchange (CBOE) is a derivatives and securities exchange network that provides trading solutions and products in asset classes that include equities, derivatives, and foreign exchange in North America, Europe, and the Asia Pacific region.
The Consumer Price Index (CPI) measures the change in prices paid by consumers for goods and services. The U.S. Bureau of Labor Statistics bases the index on prices of food, clothing, shelter, fuels, transportation, doctors’ and dentists’ services, drugs, and other goods and services that people buy for day-to-day living. Prices are collected each month in 75 urban areas across the country from about 6,000 households and 22,000 retailers.
Capital expenditures, or capex, are monies used by a company to buy, improve, or maintain physical assets such as real estate, facilities, technology, or equipment, and may include new projects or investments.
A correction is a decline in the market price of a security or index of more than 10% from its recent highs but not more than 20%.
Correlation is a statistic that measures the degree to which two securities or variables move in relation to each other. Negative correlation, also known as inverse correlation, tracks the movement of two variables that tend to move in opposite directions, so that when one rises, the other falls.
Defensive sectors include companies that tend to have a constant demand for their products or services, making their operations more stable during different phases of the business cycle.
Defensive stocks provide consistent dividends and stable earnings regardless of whether the overall stock market is rising or falling. Companies with shares considered to be defensive tend to have a constant demand for their products or services and thus their operations are more stable during different phases of the business cycle.
Dividend payers are the companies that distribute a portion of their profits to shareholders in the form of a dividend.
Dividend growers are companies that have followed a policy of consistently increasing dividends every year over a period of years.
Duration incorporates a bond’s yield, coupon, final maturity, and call features into one number, expressed in years, that indicates how price-sensitive a bond or portfolio is to changes in interest rates. Bonds with higher durations carry more risk and have higher price volatility than bonds with lower durations.
The Federal Open Market Committee (FOMC) consists of 12 members: the seven members of the Board of Governors of the Federal Reserve System; the president of the Federal Reserve Bank of New York; and four of the remaining 11 Reserve Bank presidents, who serve one-year terms on a rotating basis. The FOMC holds eight regularly scheduled meetings per year at which it reviews economic and financial conditions, determines the appropriate stance of monetary policy, and assesses the risks to its long-run goals of price stability and sustainable economic growth.
Fiscal policy refers to the tax collection and spending a government uses to influence its country’s economy.
Guidance refers statements from the managers of publicly traded companies that indicate whether they expect to realize near-term profits or losses
and why.
A hedge is an investment or investment strategy that is designed to lessen the potential for losses in other investments. The price of an investment considered to be a hedge often moves in the opposite direction of the prices of the investments being hedged.
Levered or leveraged exchange-traded funds use financial derivatives and debt to enhance the daily returns of the indices or other assets they track. The use of leverage carries a risk, as it has the potential to lead to significant gains or significant losses.
Liberation Day is a term used by President Donald Trump to refer to April 2, 2025, when he announced a wide range of unexpectedly high tariffs on many U.S. trading partners, triggering a global selloff of risk assets.
Market capitalization, or market cap, refers to the total dollar market value of a company’s outstanding shares of stock.
An option is a financial instrument based on the value of underlying securities such as stocks. An options contract offers its buyers the opportunity to buy or sell — depending on the type of contract they hold — the underlying asset.
Oversold is a term used to describe a security or group of securities believed to be trading at a level below its or their intrinsic or fair value.
A pullback is a temporary pause or drop in the price of a security that previously had been rising.
Pricing power refers to a company’s ability to manipulate the price of a product or service in the marketplace by controlling the level of supply, demand, or both.
The Producer Price Index (PPI), published monthly by the U.S. Bureau of Labor Statistics, measures the average change over time in the selling prices received by domestic producers for their output.
A risk-off scenario is typically one where sentiment is driven by a weakening growth environment, bad news that fuels a bearish outlook, and/or investor expectations of unfavorable risk/reward ratios.
Short-dated options are options contracts that have near-term expiration dates in weeks, days, or even one day. Short-dated options are often bought by traders who are focused on specific near-term events.
Stagflation, first described after the oil shocks of the 1970s, is an economic condition that includes slow economic growth (or even declines in gross domestic product), relatively high unemployment, and inflation.
Standard deviation is a measure of the dispersal or uncertainty in a random variable. For example, if a financial variable is highly volatile, it has a high standard deviation. Standard deviation is frequently used as a measure of the volatility of a random financial variable.
The University of Michigan Index of Consumer Sentiment is based on monthly telephone surveys in which at least 500 consumers in the continental United States are asked 50 questions about what they think now and what their expectations are for their personal finances, business conditions, and buying conditions. Their responses are used to calculate monthly measures of consumer sentiment that can be compared to a base value of 100 set in 1966.
Unwinding describes the process of closing out what is often a large or complicated trading position.
Indices
The S&P 500 Index measures changes in stock market conditions based on the average performance of 500 widely held common stocks. It is a market-weighted index calculated on a total return basis with dividend reinvested. The S&P 500 represents approximately 80% of the investable U.S. equity market.
The Nasdaq Composite Index is the market capitalization-weighted index of over 2,500 common equities listed on the Nasdaq stock exchange.
The Bovespa Index, or Ibovespa, tracks major companies in the Brazilian capital market and accounts for about 80% of the number of trades and the financial volume of the Brazilian capital markets.
The Russell 2000® Index measures the performance of the small-cap segment of the US equity universe. The Russell 2000 Index is a subset of the Russell 3000® Index and includes approximately 2,000 of the smallest securities based on a combination of their market cap and current index membership.
London Stock Exchange Group plc and its group undertakings (collectively, the “LSE Group”). ©LSE Group 2025. FTSE Russell is a trading name of certain of the LSE Group companies. Russell® is a trademark of the relevant LSE Group companies and is used by any other LSE Group company under license. All rights in the FTSE Russell indexes or data vest in the relevant LSE Group company which owns the index or the data. Neither LSE Group nor its licensors accept any liability for any errors or omissions in the indexes or data and no party may rely on any indexes or data contained in this communication. No further distribution of data from the LSE Group is permitted without the relevant LSE Group company’s express written consent. The LSE Group does not promote, sponsor, or endorse the content of this communication.
M-716464 Exp. 8/7/2025
