“
”Markets in Focus
Timely analysis of market moves and sectors of opportunity
Volatility is likely to pick up in advance of the upcoming election, but we could see more highs heading into year-end as the market continues to grind higher.
It took two years of pain and hard work to recover from the stock market drawdown of 2022. Now Matt Orton, Chief Market Strategist, CFA, sees this as a time when investors should consider embracing the all-time highs this year.
Many investors are hiding out in money market funds and fear a major correction after a strong run, but Orton sees plenty of opportunities for investors to explore across the market.
September started with some typical weakness due to economic concerns and questions around the U.S. Federal Reserve (Fed), but it ended at an all-time high.
“The bull market is alive and well,” said Matt Orton, CFA, Chief Market Strategist at Raymond James Investment Management, “and while volatility might pick up with elections coming into focus and some important economic data releases, I continue to believe that we’ll see more highs heading into the end of the year as the market continues to grind higher.”
Orton has been most encouraged by the improvement in market breadth, both across sectors and market capitalizations. The third quarter’s top-performing sectors were utilities, real estate, industrials, financials, and materials. Both the Russell 2000® Index and the S&P 500® Equal Weight Index surged ahead of the cap-weighted index in the quarter, outperforming the S&P 500 by 3.53% and 4.00%, respectively, as of Sept. 27, 2024.1
“From a technical perspective, the set-up also looks encouraging,” Orton said. He noted that 79% of the S&P 500 Index members are trading above their 200-day moving average. This is above their five-year average of 62%. However, it has yet to reach 85%, 2024’s peak back in March. “This highlights that the market hasn’t become too stretched,” he said.
Earnings season kicks off at the end of next week, and Orton believes it will be critical to sustain these healthy trends. He’s optimistic and looks forward to what the money center banks say about the state of the American consumer.
“I believe mega-cap stocks and technology leadership need to hold up,” Orton said. “Recent earnings from a top memory solutions company provide encouraging signals for the artificial intelligence semiconductor space, and technology’s recent stagnation could provide an interesting opportunity. Overall, I think that investors might want to consider the possibility of leaning into a risk-on asset allocation and might consider increasing balance to cyclical equities and small caps as recession fears seem overblown.”
Orton believes there are many parts of this market that are just starting to break out. He said investors might consider leaning into near-term volatility around noisy data and risks associated with elections or other significant events, possibly re-evaluating their portfolios for these trends into next year.
Orton expects a busy week from a data perspective with the focus on the U.S. jobs market. He believes decent employment data might push back against the current market pricing of a more aggressive rate cut trajectory than he believes is warranted. If that’s how the data comes in, then Orton wouldn’t be surprised to see U.S. Treasury yields rise slightly as a result.
“I do not think this will be an issue for the bull market, and I believe any volatility as a result could be used to consider the idea of putting more capital to work,” Orton said. “There are several reasons not to expect a recession. This includes a lack of weakness in the most cyclical parts of demand and the failure of other labor market trends to corroborate the rise in unemployment.”
Orton hasn’t seen significant imbalances in the economy develop like they typically do before a recession. Plus, he believes financial conditions are easing. Inflation is coming down while the economy is slowing, but not breaking. Orton finds this could be a supportive backdrop for risk assets.
“I want to drive home the point that investors should consider embracing this environment, not continuing to worry about it,” Orton said. “There was a great article in the Wall Street Journal last weekend called The Fed made its move. Why didn’t I?. It highlighted there are still too many investors hiding out in money market funds. Perhaps, they don’t know it’s the easy way out.” Orton believes some investors worry that the market is due for a major correction after an incredibly strong run.
“I will continue to pound the table for thinking about embracing the all-time highs this year, as they came after two years of pain and hard work to recover,” Orton said. “U.S. growth has remained strong, and gross domestic product data last week showed unambiguously strong revisions.”
Orton said final domestic demand has grown at a seasonally adjusted annual rate (SAAR) north of 2.5% in each of the last six quarters. There’s scope for the productivity increases to actually put the economy earlier in the cycle than many have thought. Orton believes this positive fundamental backdrop helped to buoy earnings and put the S&P 500 on track to close the third quarter with a year-to-date gain of 20.8%. This is the seventh strongest performance for the first nine months of the year since 1957.
“Historically speaking, this tends to bode well for market performance in the fourth quarter,” Orton said. “In the 14 prior years when the S&P 500 Index gained 15% or more during the first three quarters, the fourth-quarter median gain was 5.44%. This includes a strong hit rate that was positive 11 out of 14 times: That’s 78.6% of the time.”
A quarter of catch-up
Quarterly index returns relative to the S&P 500
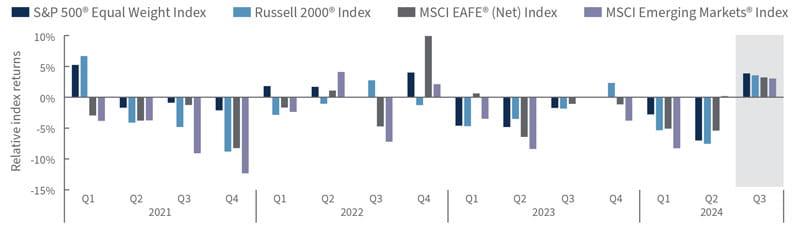
Source: Bloomberg, as of 9/27/2024.
Orton said the worst fourth-quarter period was the crash of 1987, down 23.2%. The other two negative fourth quarters were 1967 and 1983, with minor losses of 0.25% and 0.69%, respectively. Orton finds these statistics encouraging and suggests investors consider participating in the market and think about being ready to use downside in an effort to consider the idea of repositioning their portfolios dependent upon their individual situations.
Orton points out that the rotation beneath the surface dominated the third quarter, with an increase in earnings breadth finally starting to translate to increased breadth in prices.
“I think this rotation might continue if earnings remain solid, which could make the fourth quarter another quarter for breadth to continue catching up,” he said. “This increase in breadth has helped buck the seasonal trend of a weaker third quarter.”
Orton said the third quarter is historically the only period in which the S&P 500 Index has recorded an average negative return since 1980. Fourth-quarter returns are historically the strongest and most frequently positive compared to the other quarters. He added only 59% of third quarters have had positive returns, which is the index’s worst quarterly batting average. However, more than 80% of the S&P 500’s fourth quarters have been positive. Orton believes plenty of opportunities remain across the market. He highlights four on this chart, but says this is not an exhaustive list.
With that in mind, Orton’s investment playbook is focused on a few key areas:
Small caps. Orton sees some sustainable signs of life down the market cap spectrum with the Russell 2000® Index outperforming the S&P 500 by 243 basis points (bps) since the Fed rate cut on Sept. 18. Small caps have been outperforming quarter to date for the third quarter, but Orton said an easing cycle with falling rates and borrowing costs could drive even better relative performance going forward. Despite the recent outperformance, Orton believes several extremes remain between the relative performance of large versus small caps. For example, the two largest companies in the S&P 500 Index are bigger from a market capitalization perspective than the entire Russell 2000 Index, and the top five companies are 4.3 times larger than the entire Russell 2000 Index.
“Small-cap valuations on an absolute and relative basis could remain attractive, and small-cap earnings growth seems to be at an inflection point,” Orton said. “If smaller companies start to deliver growth and revisions start to tick higher, then I think that could be more than enough to possibly keep the macroeconomic backdrop supportive of small cap outperformance.”
Global diversification. Orton said the massive rally in Chinese equities spurred by the announcement of a rate cut and other various policy easing measures dominated trading last week.
Equities around the world with significant Chinese revenue exposure sharply reversed their downtrends. This is especially visible in the charts of European luxury goods companies and global miners. Orton believes the People’s Bank of China policy package could be enough to put a floor around current equity valuations where the deflationary reality is more or less discounted. Orton said it will be critical to see the market follow through this week as well as for China to provide additional fiscal measures going forward to sustain the rally.
“I’ve been very negative on China, and rightfully so, but if we see a fiscal bazooka that could certainly change,” Orton said. “However, the capitulation in China should put our focus on other opportunities globally and highlight the opportunities that exist around the world. India, my most preferred region globally, has continued to see all-time highs in the NIFTY 50 Index.”
Orton said outside of emerging markets, the STOXX® Europe 600 Index surged to new all-time highs last week . He believes an increasingly positive case can be made to see a more rapid earnings recovery globally and that would support the case for investors to explore the potential to add portfolio exposure outside of the United States.
Cyclicality. Orton said value has outperformed growth from a pure index style perspective, but growth, small caps, and higher-beta stocks tend to outperform in a slow rate-cutting environment. While sectors like utilities have been the big outperformer in the third quarter, Orton believes they are no longer just a defensive play. He said instead utilities with exposure to data center growth are driving the outperformance.
“Rather than bank on value outperforming simply because rates are coming down and many sectors still look cheap, I prefer to lean into cyclicals where the earnings lift can continue to come from these powerful growth trends in the economy,” he said. “Some examples include artificial intelligence, reshoring, and defense.
“Industrials are finally breaking from a prolonged period of relative underperformance,” he said. “I like sectors such as electrical equipment due to data center exposure and machinery due to a lift from infrastructure and maybe a stronger Chinese economy.”
Given the importance of selectivity in this market, Orton believes investors can consider looking to these areas of the market to find value and get exposure to the trends poised to drive growth going forward.
Orton said it will be a busy week of data, culminating in the U.S. jobs report for September on Friday. Also, he believes global central bankers are back in full swing with appearances throughout the week alongside several important data releases.
European Central Bank President Christine Lagarde will discuss the latest rate reduction with the European Parliament. In the U.S., Federal Reserve governors scheduled to speak include:
1 Unless otherwise indicated, all data cited is sourced from Bloomberg as of September 27, 2024.
Risk Information:
Investing involves risk, including risk of loss.
Diversification does not ensure a profit or guarantee against loss.
Disclosures:
Index or benchmark performance presented in this document does not reflect the deduction of advisory fees, transaction charges, or other expenses, which would reduce performance. Indexes are unmanaged. It is not possible to invest directly in an index. Any investor who attempts to mimic the performance of an index would incur fees and expenses that would reduce return.
This document is a general communication being provided for informational purposes only. It is educational in nature and not designed to be taken as advice or a recommendation for any specific investment product, strategy, plan feature, or other purpose in any jurisdiction, nor is it a commitment from Raymond James Investment Management or any of its affiliates to participate in any of the transactions mentioned herein. Any examples used are generic, hypothetical, and for illustration purposes only. This material does not contain sufficient information to support an investment decision, and you should not rely on it in evaluating the merits of investing in any securities or products. In addition, users should make an independent assessment of the legal, regulatory, tax, credit, and accounting implications and make their own determinations together with their own professionals in those fields. Any forecasts, figures, opinions, or investment techniques and strategies set out are for information purposes only, based on certain assumptions and current market conditions, and are subject to change without prior notice. All information presented herein is considered to be accurate at the time of production, but no warranty of accuracy is given and no liability in respect of any error or omission is accepted. It should be noted that investment involves risks, the value of investments and the income from them may fluctuate in accordance with market conditions and taxation agreements, and investors may not get back the full amount invested. Both past performance and yields are not reliable indicators of current and future results.
The views and opinions expressed are not necessarily those of the broker/dealer or any affiliates. Nothing discussed or suggested should be construed as permission to supersede or circumvent any broker/dealer policies, procedures, rules, and guidelines.
Link(s) are being provided for informational purposes only. Raymond James Investment Management is not affiliated with and does not endorse, authorize or sponsor any of the listed websites or their respective sponsors. Raymond James Investment Management is not responsible for the content of any website or the collection or use of information regarding any website's users and/or members.
Sector investments are companies engaged in business related to a specific sector. They are subject to fierce competition and their products and services may be subject to rapid obsolescence. There are additional risks associated with investing in an individual sector, including limited diversification.
Investing in small cap stocks generally involves greater risks, and therefore, may not be appropriate for every investor. The prices of small company stocks may be subject to more volatility than those of large company stocks.
International investing presents specific risks, such as currency fluctuations, differences in financial accounting standards, and potential political and economic instability. These risks are further accentuated in emerging market countries where risks can also include possible economic dependency on revenues from particular commodities or on international aid or development assistance, currency transfer restrictions, and liquidity risks related to lower trading volumes.
Definitions
Basis points (bps) are measurements used in discussions of interest rates and other percentages in finance. One basis point is equal to 1/100th of 1%, or 0.01%.
A batting average, in finance, is a measure of the record of a manager or part of the market to beat the market consistently. It is calculated by dividing the number of quarters (or months) in which the manager or part of the market beat or matched an index by the total number of quarters (or months) in the period. For example, a manager who meets or outperforms the market every quarter in a given period would have a batting average of 100. A manager who beats the market half of the time would have a batting average of 50.
Beta is a measure of the volatility or systemic risk of a security, group of securities, or portfolio compared with the market as a whole.
Breadth describes the relationship between the median and the mean of a market index. When a few data outliers result in a mean that is substantially larger (or smaller) than the median of the full data set, then the performance of the entire index is being driven by a “narrow” selection of companies. An index supported by “broad” market movements is one where the median is closer to the mean.
A crash is a sudden and significant drop in the value of a market. Crashes can be triggered by deteriorating or suddenly changing economic conditions as well as by investor panic over falling asset prices.
Cyclical forces describe trends and changes in market conditions that occur as the economy passes through the business cycle’s stages of expansion, peak, recession, and recovery.
Cyclical stocks have prices influenced by macroeconomic changes in the economy and are known for following the economy as it cycles through expansion, peak, recession, and recovery.
A daily moving average (DMA) is a calculation that takes the arithmetic mean of a given set of prices over the specific number of days in the past; for example, over the previous 15, 30, 100, or 200 days.
Defensive stocks provide consistent dividends and stable earnings regardless of whether the overall stock market is rising or falling. Companies with shares considered to be defensive tend to have a constant demand for their products or services and thus their operations are more stable during different phases of the business cycle
A drawdown is a decline in the returns of a security or group of securities, as measured over a period from the peak of returns to their trough.
An earnings inflection marks a sudden change in the direction and rate of change of earnings growth. Earnings inflections can lead to either positive or negative change.
An earnings recession is considered to be two or more consecutive quarters of declining corporate year-over-year profits.
The Federal Open Market Committee (FOMC) consists of 12 members: the seven members of the Board of Governors of the Federal Reserve System; the president of the Federal Reserve Bank of New York; and four of the remaining 11 Reserve Bank presidents, who serve one-year terms on a rotating basis. The FOMC holds eight regularly scheduled meetings per year at which it reviews economic and financial conditions, determines the appropriate stance of monetary policy, and assesses the risks to its long-run goals of price stability and sustainable economic growth.
Final sales to domestic purchasers is a subset of the U.S. Bureau of Economic Analysis’ quarterly gross domestic product report. It is a measure of how much U.S.-based purchasers, not including the government, spend on both domestically produced and imported goods. It does not account for changes in inventories or net exports of goods sold outside the United States.
Gross domestic product (GDP) is the total value of goods and services provided in an economy during a specified period, often one year.
A hit rate reflects the percentage of holdings in an index or investment portfolio that generate positive returns over a specified period of time.
Mega-cap tech stocks are the technology companies with market capitalizations that are in the trillions or hundreds of billions of U.S. dollars, levels that far exceed many of the other stocks in the S&P 500 Index.
Market capitalization, or market cap, refers to the total dollar market value of a company’s outstanding shares of stock.
Money center banks are large banks situated in economic hubs that primarily deal with governments, other banks, and big corporations.
Investor positioning refers to assessments of whether professional investors are, on the whole, bullish or bearish on a particular security, industry, sector, market capitalization or other area of the market, as reflected by the extent to which they are invested in the area of the market in question.
Risk assets refer to investments such as equities, commodities, high-yield bonds, real estate, and currencies, where the value may rise or fall due to fluctuating interest rates, changes in credit quality, default risks, supply and demand disruption, and other factors.
Rotation describes the movement of investments in securities from one industry, sector, factor, or asset class to another as market participants react to or try to anticipate the next stage of the economic cycle.
A seasonally adjusted annual rate (SAAR) is a rate adjustment used for economic or business data, such as sales numbers or employment figures, that attempts to remove seasonal variations in the data. Most data is affected by the time of the year, and adjusting for the seasonality means that more accurate relative comparisons can be drawn between different time periods.
The summary of economic projections is produced following meetings of the Federal Open Market Committee and includes meeting participants’ projections of the most likely outcomes for real gross domestic product growth, the unemployment rate, and inflation for a forward-looking three-year window and over the longer run.
Technicals refers to technical indicators of historic market data, including price and volume statistics, to which analysts apply a wide variety of mathematical formulas in their study of larger market patterns.
Visibility reflects the degree to which a company’s management or the analysts who follow it can reliably estimate future near- or long-term performance.
Indices
The S&P 500 Index measures change in stock market conditions based on the average performance of 500 widely held common stocks. It is a market-weighted index calculated on a total return basis with dividend reinvested. The S&P 500 represents approximately 80% of the investable U.S. equity market.
The S&P 500® Equal Weight Index is the equal-weight version of the S&P 500. It includes the same constituents as the capitalization-weighted S&P 500, but each company in the S&P 500 Equal Weight Index is allocated a fixed weight, or 0.2% of the index total at each quarterly rebalance.
The Russell 2000® Index measures the performance of the 2,000 smallest companies in the Russell 3000® Index, which represents approximately 7% of the total market capitalization of the Russell 3000® Index.
The MSCI EAFE® (Net) Index measures the performance of performance of large and mid-cap securities across 21 developed markets, including countries in Europe, Australasia and the Far East, excluding the United States and Canada. The MSCI EAFE® (Net) Index subtracts any foreign taxes applicable to US citizens but not applicable to citizens in the overseas country.
The MSCI Emerging Markets® Index measures the performance of large and mid-cap stocks across 24 emerging markets (EM) countries.
The NIFTY 50 Index is a stock index on the National Stock Exchange of India that tracks the largest assets in the Indian equity market. It is diversified across 13 sectors of the Indian economy: financial services, information technology, consumer goods, oil and gas, automobiles, telecommunications, construction, pharmaceuticals, metals, power, cement and cement products, fertilizers and pesticides, and media and entertainment.
London Stock Exchange Group plc and its group undertakings (collectively, the “LSE Group”). ©LSE Group 2024. FTSE Russell is a trading name of certain of the LSE Group companies. Russell® is a trademark of the relevant LSE Group companies and is used by any other LSE Group company under license. All rights in the FTSE Russell indexes or data vest in the relevant LSE Group company which owns the index or the data. Neither LSE Group nor its licensors accept any liability for any errors or omissions in the indexes or data and no party may rely on any indexes or data contained in this communication. No further distribution of data from the LSE Group is permitted without the relevant LSE Group company’s express written consent. The LSE Group does not promote, sponsor, or endorse the content of this communication.
The STOXX® Europe 600 Index represents 600 large-, mid- and small-capitalization companies across 17 European countries: Austria, Belgium, Denmark, Finland, France, Germany, Ireland, Italy, Luxembourg, the Netherlands, Norway, Poland, Portugal, Spain, Sweden, Switzerland, and the United Kingdom.
M-615296 Exp. 1/30/2025
