“
”Markets in Focus
Timely analysis of market moves and sectors of opportunity
After months of anticipation, breadth is finally – and very necessarily – expanding.
Last week’s economic data gave the markets reason to be optimistic with the risk of stagflation fading and expectations for interest rate cuts getting pulled nearer into the future.
Three areas to keep in mind: Small caps. Defensive sectors. Long-term secular megatrends.
After last week’s hectic slate of earnings and economic data, the S&P 500 Index finished -0.83% lower, driven by weakness in mega-cap stocks and a continuation in the rotation under the surface.1 Three developments worth noting:
First, on Wednesday alone, the S&P 500 plunged 2.31%, breaking its 356-trading day streak without falling at least 2%.
Next, since the rotation began on July 10, the S&P 500 and Nasdaq Composite indices are down -3.07% and -6.91%, respectively, while the Russell 2000® Index is up a staggering 10.18%.
Last, the S&P 500® Equal Weight Index is now outperforming its cap-weighted counterpart by 4.36% in July. If the trend continues through the end of the month, July would be only the second month in 2024 when the cap-weighted index underperformed.
“This is what we’ve all been waiting for, not the end of the bull market,” said Joey Del Guercio, Research Associate for Market Strategy at Raymond James Investment Management. The S&P 500 is still up 15.35% year to date and 34.05% since the index’s October 2023 lows.
Last week’s economic data gave the markets reason to be optimistic with the risk of stagflation fading and expectations for interest rate cuts getting pulled nearer into the future. Thursday’s gross domestic product (GDP) data came in far hotter than expected at an annualized 2.8% quarter over quarter versus the consensus expectation of 2.0%. On Friday, the Personal Consumption Expenditures (PCE) Price Index for June was in line with expectations at 2.5% year over year, moderating from May’s 2.6%. Notably, the U.S. Federal Reserve’s preferred measure of inflation, core PCE, came in slightly above estimates (2.6% versus 2.6% in May and 2.8% in April), but was shaken off by the markets as good enough to solidify faith in the disinflationary trend.
Rotation from mega-cap winners to small caps continues
Weekly returns: Russell 2000 minus the Magnificent Seven
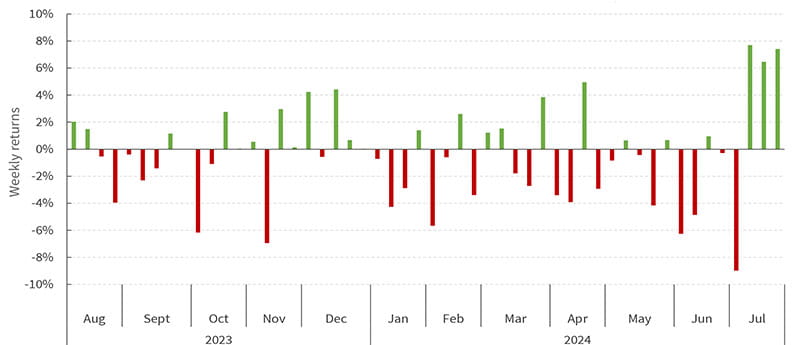
Source: Bloomberg; as of 7/26/24.
This data helped contribute to rate cuts getting priced sooner: There’s now about 1.1 cuts priced into the September meeting of the Federal Open Market Committee (FOMC), and about 1.8 and 2.7 cuts priced in by the November and December meetings, respectively. This Wednesday brings an FOMC rate decision that will almost certainly be another pause. That said, all eyes will be on Federal Reserve Chair Jerome Powell and his (now) predictably dovish post-meeting press conference that could solidify expectations for a cut in September..
“There’s plenty of economic data this week that could further alter the path for cuts, and even more before September’s meeting,” Del Guercio said. “Investors would be wise to practice patience and anticipate volatility.”
Last week was the first of the second quarter’s two biggest weeks of earnings with 136 S&P 500 constituent companies reporting. Earnings growth estimates for the S&P 500 were revised up 1.4% last week to 11.3% with healthcare, industrials, and materials getting revised up the most. Earnings growth estimates for the S&P 500 excluding the Magnificent Seven got revised up by 1.5% last week and currently stand at 7.3%, indicating that the Magnificent Seven alone will contribute roughly 35% of the overall index’s earnings growth this quarter.
The focus on the Magnificent Seven remains intense, as the group’s first two members reported earnings last week. An electric car maker posted a disappointing report and got punished by the markets. A search engine company that is an artificial intelligence (AI) beneficiary reported results that broadly exceeded expectations, only to see that news overshadowed by management commentary. With the AI trade in question, investors are laser-focused on the current state of the hyper-scalers and the AI ecosystem as a whole. Essentially, the market is asking: “When are you going to get a return on this capital spending, and what will that return be?” While the hyper-scalers are generating hundreds of billions of dollars in free cash flow per year in aggregate, they also are spending hundreds of billions on capital expenditures per year to build out the AI infrastructure.
“Investors want answers,” Del Guercio said. “Expect the market to seek out and reward clear AI monetization strategies that will help justify all of the spending to date while punishing vague generalities.”
Clearly there’s fatigue in the markets surrounding AI, but Del Guercio doesn’t think it’s time yet to abandon the trade. Breadth is finally expanding, and returns are spreading out down the market-cap spectrum as well as across different sectors and industries.
“This is an environment in which I believe selectivity and active management can thrive,” he said. “Continue to expect earnings to be the ultimate determinant of where performance goes from here and whether the rotation continues. We certainly find ourselves in a market correction given the extreme index concentration that has dominated the news over the past couple years, but this correction is just a bump in a broader bull market that has legs. Don’t forget that the S&P 500 went through a 25% drawdown that took all of 2022 and 2023 to get out of!”
Consequently, Del Guercio suggests investors consider using the volatility that’s bound to come as an opportunity to build long-term positions in quality businesses that are tied to key long-term secular themes:
A small-cap summer. While the S&P 500 has made 38 all-time highs in 2024, the Russell 2000 stands in sharp contrast: It is still 8% away from its November 2021 all-time high. The mean reversion trade on small caps relative to the rest of the market has plenty of room to run, Del Guercio said, and the space should continue to benefit more than large-cap stocks from the economic backdrop becoming more supportive of rate cuts materializing sooner. Small caps also stand to benefit from mergers and acquisitions (M&A) and capital markets activity overall picking up from its suppressed levels, which he said should follow rate cuts.
Time to get defensive? Since the so-called “Great Rotation” began on July 10, the S&P 500’s best-performing sector has been real estate (+5.3%), outperforming information technology (-9.2%) by a staggering 14.5%. Over the same time, the only sectors to underperform the S&P 500 were the big three winners of the last year: information technology, communication services, and consumer discretionary. That trend held true last week as well when utilities, healthcare, and materials were the best-performing sectors.
“While I don’t think investors need to abandon the growth-centric sectors, I do think it makes sense to consider ratcheting up allocations to bond proxies like real estate and utilities that should benefit from falling rates and hunting for lower beta in sectors like healthcare and financials to balance out portfolios,” Del Guercio said.
Don’t forget the megatrends. Whether it comes from earnings, economic reports, or in anticipation of the U.S. election, Del Guercio said investors should anticipate a pickup in volatility. Be patient, he said, and think about using volatility as an opportunity to position portfolios ahead of long-term megatrends like:
The next leg of the AI trade,
The build-out of America’s antiquated infrastructure and electrical grid,
The United States’ aging population and changing demographic trends, and
A resurgence in capital expenditures tied to the onshoring and reshoring of production.
Wednesday’s FOMC interest rate decision headlines a busy week of earnings and economic data releases.
On the earnings front, 171 S&P 500 companies will report, led by four Magnificent Seven companies. Del Guercio suggests also keeping an eye on commentary from key consumer companies and results from semiconductor and major energy companies.
The economic calendar includes the Job Openings and Labor Turnover Survey (JOLTS) on Tuesday; the ADP® National Employment Report™ and Employment Cost Index, plus interest rate decisions from the FOMC and Bank of Japan on Wednesday; the Bank of England rate decision and Institute for Supply Management manufacturing Purchasing Managers’ Index on Thursday, and the jobs report and unemployment rate on Friday.
1 Unless otherwise indicated, all data cited is sourced from Bloomberg as of July 26, 2024..
Risk Information:
Investing involves risk, including risk of loss.
Diversification does not ensure a profit or guarantee against loss.
Disclosures:
Index or benchmark performance presented in this document does not reflect the deduction of advisory fees, transaction charges, or other expenses, which would reduce performance. Indexes are unmanaged. It is not possible to invest directly in an index. Any investor who attempts to mimic the performance of an index would incur fees and expenses that would reduce return.
This document is a general communication being provided for informational purposes only. It is educational in nature and not designed to be taken as advice or a recommendation for any specific investment product, strategy, plan feature, or other purpose in any jurisdiction, nor is it a commitment from Raymond James Investment Management or any of its affiliates to participate in any of the transactions mentioned herein. Any examples used are generic, hypothetical, and for illustration purposes only. This material does not contain sufficient information to support an investment decision, and you should not rely on it in evaluating the merits of investing in any securities or products. In addition, users should make an independent assessment of the legal, regulatory, tax, credit, and accounting implications and make their own determinations together with their own professionals in those fields. Any forecasts, figures, opinions, or investment techniques and strategies set out are for information purposes only, based on certain assumptions and current market conditions, and are subject to change without prior notice. All information presented herein is considered to be accurate at the time of production, but no warranty of accuracy is given and no liability in respect of any error or omission is accepted. It should be noted that investment involves risks, the value of investments and the income from them may fluctuate in accordance with market conditions and taxation agreements, and investors may not get back the full amount invested. Both past performance and yields are not reliable indicators of current and future results.
The views and opinions expressed are not necessarily those of the broker/dealer or any affiliates. Nothing discussed or suggested should be construed as permission to supersede or circumvent any broker/dealer policies, procedures, rules, and guidelines.
Link(s) are being provided for informational purposes only. Raymond James Investment Management is not affiliated with and does not endorse, authorize or sponsor any of the listed websites or their respective sponsors. Raymond James Investment Management is not responsible for the content of any website or the collection or use of information regarding any website's users and/or members.
Sector investments are companies engaged in business related to a specific sector. They are subject to fierce competition and their products and services may be subject to rapid obsolescence. There are additional risks associated with investing in an individual sector, including limited diversification.
Investing in small cap stocks generally involves greater risks, and therefore, may not be appropriate for every investor. The prices of small company stocks may be subject to more volatility than those of large company stocks.
International investing presents specific risks, such as currency fluctuations, differences in financial accounting standards, and potential political and economic instability. These risks are further accentuated in emerging market countries where risks can also include possible economic dependency on revenues from particular commodities or on international aid or development assistance, currency transfer restrictions, and liquidity risks related to lower trading volumes.
Definitions
The ADP® National Employment Report™ is published monthly by the ADP Research Institute® in close collaboration with Moody’s Analytics. The ADP® National Employment Report™ provides a monthly snapshot of U.S. nonfarm private sector Employment based on actual transactional payroll data.
Annualized estimates represent short-term calculations or rates that have been converted into annual rates.
A beat is when a company’s reported earnings or other business results exceed or are better than the expectations of analysts and others who follow the company’s stock.
A bond proxy is a term used to describe equity shares are other securities that provide comparably predictable levels of return to bonds. Bond proxies include dividend-paying stocks, including those in industries with more predictable revenue streams such as utilities and consumer staples.
Breadth describes the relationship between the median and the mean of a market index. When a few data outliers result in a mean that is substantially larger (or smaller) than the median of the full data set, then the performance of the entire index is being driven by a “narrow” selection of companies. An index supported by “broad” market movements is one where the median is closer to the mean.
Concentration is a term used to describe the extent to which investments in a portfolio, group of portfolios, industry, sector, index, or particular geography or clustered in groups that share specific factors or other characteristics.
A consensus estimate is a forecast of a public company’s projected earnings, the results of a particular industry, sector, geography, asset class, or other category, or the expected findings of a macroeconomic report based on the combined estimates of analysts and other market observers that track the stock or data in question.
Core PCE, officially known as the Personal Consumption Expenditures (PCE) excluding Food and Energy, Price Index, is a measure of the prices that U.S. consumers pay for goods and services, not including two categories – food and energy – where prices tend to swing up and down more dramatically and more often than other prices. The core PCE price index, released monthly by the U.S. Department of Commerce Bureau of Economic Analysis, measures inflation trends and is watched closely by the U.S. Federal Reserve as it conducts monetary policy.
Defensive sectors include companies that tend to have a constant demand for their products or services, making their operations more stable during different phases of the business cycle.
Disinflation refers to the temporary slowing of the pace of price inflation and describes what happens when the inflation rate is marginally lower over the short term. Disinflation refers only to the rate of change in the rate of inflation. In this, it is distinct from inflation and deflation, which describe the direction of prices.
Dovish, hawkish, and centrist are terms used to describe the monetary policy preferences of central bankers and others. Doves tend to support maintaining lower interest rates, often in support of stimulating job growth and the economy more generally. Hawks prioritize controlling inflation and may favor raising interest rates to reduce it or keep it in check. Centrists tend to occupy the middle of the continuum between tight (hawkish) and loose (dovish) monetary policy.
A drawdown is a decline in the returns of a security or group of securities, as measured over a period from the peak of returns to their trough.
Earnings per share (EPS) is calculated as a company’s profit divided by the outstanding shares of its common stock. The resulting number serves as an indicator of a company’s profitability.
The Employment Cost Index measures the change in the cost of labor, free from the influence of employment shifts among occupations and industries, for three- and 12-month periods. The U.S. Bureau of Labor Statistics collects data for the index from thousands of private and government employers nationwide.
The Federal Open Market Committee (FOMC) consists of 12 members: the seven members of the Board of Governors of the Federal Reserve System; the president of the Federal Reserve Bank of New York; and four of the remaining 11 Reserve Bank presidents, who serve one-year terms on a rotating basis. The FOMC holds eight regularly scheduled meetings per year at which it reviews economic and financial conditions, determines the appropriate stance of monetary policy, and assesses the risks to its long-run goals of price stability and sustainable economic growth.
Growth investing is a stock-buying strategy that focuses on companies expected to grow at an above-average rate compared to their industry or the market.
Hyperscaler refers to the largest cloud computing providers that can provide massive amounts of computing resources and storage at enterprise scale.
The Institute for Supply Management (ISM) Purchasing Managers’ Index (PMI) measures the prevailing direction of economic trends in the manufacturing sector. It consists of an index summarizing whether market conditions as reported in a monthly survey of supply chain managers are expanding, staying the same, or contracting.
The jobs report, officially known as the Employment Situation Summary, is a monthly U.S. Bureau of Labor Statistics (BLS) report tracking nonfarm payroll employment and the national unemployment rate, with data on changes in average hourly earnings, and job trends in public and private sectors of employment. The report is based on surveys of households and employers.
The Job Openings and Labor Turnover Survey (JOLTS) program produces monthly data on job openings, hires, and separations compiled by the U.S. Bureau of Labor Statistics. The survey’s job openings rates consider month-to-month changes in the number of job openings reported on both a state and national level.
The Magnificent Seven refers to the seven largest stocks by market capitalization in the S&P 500 Index, as of Dec. 29, 2023. At that time, they made up more than 25% of the market capitalization of the entire index. They are Alphabet, Amazon.com, Apple, Meta Platforms, Microsoft, NVIDIA and Tesla.
Market capitalization, or market cap, refers to the total dollar market value of a company’s outstanding shares of stock.
A mean reversion trade is one that seeks to capitalize on the tendency of asset prices that have significantly moved away from their long-term averages, or means, to move back toward those means over time.
Mega-cap stocks are the largest publicly traded companies as measured by market capitalization. Generally, this refers to companies with market capitalizations over $200 billion.
A megatrend is a widespread and long-term macroeconomic, technological, social, environmental, political, or other change that may develop slowly at first but that has a major, ongoing impact once it gets underway. Megatrends are distinct from smaller trends in business, economic, or other spheres of activity that have less far-reaching or enduring effects.
Onshoring describes an effort to bring manufacturing and other services back to the United States from overseas operations.
The Personal Consumption Expenditures (PCE) Price Index, excluding food and energy, known as the core PCE index, is a measure of the prices that people living in the United States, or those buying on their behalf, pay for goods and services. The PCE price index, released monthly by the U.S. Department of Commerce Bureau of Economic Analysis, is known for capturing inflation or deflation across a wide range of consumer expenses and reflecting changes in consumer behavior. Headline PCE inflation includes good and energy prices, which are considered to be more volatile and thus less reliable as indicators of long-term trends.
Quality investing is a strategy that seeks to invest in companies with low debt, stable earnings, consistent asset growth, and strong corporate governance, as reflected in financial metrics such as ratios of return to equity and debt to equity, as well as to earnings variability.
Reshoring describes an effort to bring manufacturing and other services back to the United States from overseas operations.
Rotation describes the movement of investments in securities from one industry, sector, factor, or asset class to another as market participants react to or try to anticipate the next stage of the economic cycle.
Secular trends are large-scale and ongoing changes in economies and societies that have the potential to drive broad and lasting economic, technological, social or other kinds of changes.
Stagflation, first described after the oil shocks of the 1970s, is an economic condition that includes slow economic growth (or even declines in gross domestic product), relatively high unemployment, and inflation.
Indices
The S&P 500 Index measures change in stock market conditions based on the average performance of 500 widely held common stocks. It is a market-weighted index calculated on a total return basis with dividend reinvested. The S&P 500 represents approximately 80% of the investable U.S. equity market.
The S&P 500® Equal Weight Index is the equal-weight version of the S&P 500. It includes the same constituents as the capitalization-weighted S&P 500, but each company in the S&P 500 Equal Weight Index is allocated a fixed weight, or 0.2% of the index total at each quarterly rebalance.
The Nasdaq Composite Index is the market capitalization-weighted index of over 2,500 common equities listed on the Nasdaq stock exchange.
The Russell 2000® Index measures the performance of the 2,000 smallest companies in the Russell 3000® Index, which represents approximately 7% of the total market capitalization of the Russell 3000® Index.
London Stock Exchange Group plc and its group undertakings (collectively, the “LSE Group”). ©LSE Group 2024. FTSE Russell is a trading name of certain of the LSE Group companies. Russell® is a trademark of the relevant LSE Group companies and is used by any other LSE Group company under license. All rights in the FTSE Russell indexes or data vest in the relevant LSE Group company which owns the index or the data. Neither LSE Group nor its licensors accept any liability for any errors or omissions in the indexes or data and no party may rely on any indexes or data contained in this communication. No further distribution of data from the LSE Group is permitted without the relevant LSE Group company's express written consent. The LSE Group does not promote, sponsor, or endorse the content of this communication.
M-584083 Exp. 11/29/2024
