“
”Markets in Focus
Timely analysis of market moves and sectors of opportunity
Heightened volatility underscores the potential benefits of considering investments focused on diversification, selectivity, and long-term secular growth mega-trends.
A further broadening of earnings growth in the fourth quarter could help tie further market gains to earnings growth, as opposed to multiple expansion.
Small caps are more than just an interest rate story. Pay attention to sales growth and operating margins, not just financing costs.
We head into the peak of earnings season over the next two weeks with a strong fundamental economic backdrop and constructive market set-up, said Matt Orton, CFA, Chief Market Strategist at Raymond James Investment Management.
First, however, the market is sorting through the implications of the selloff that began early Monday, driven by the news around an open-source artificial intelligence (AI) model developed by a Chinese company.
The new AI system reportedly could deliver performance that matches leading U.S. AI companies, while using fewer of the specialized AI semiconductors that the market leaders rely on, making it far cheaper. The news raised questions about the long-term demand for the AI chips that have driven market gains over the past two years, as well as the business outlook for the companies that have ridden that wave. In response, AI-related stocks sank in early trading Monday.
To which Orton says, take a breath.
“Obviously, the market is scared,” he said. “The market always is going to over-react to these sorts of situations. It’s too soon to say how long the selloff lasts or how deep it goes.
“What I do know,” he said, “is that this speaks to the potential benefits of having diversified portfolios and not just having exposure to some of the tech winners, but considering whether to build out into other, more cyclical parts of this market that are levered to strengths of the U.S. economy that are not just predicated on the growth of artificial intelligence. When you think about reshoring and moving manufacturing back to this country, there are a lot of other themes that are secular in nature, have momentum, and are not dictated by artificial intelligence capital expenditures.”
Taking a broader view, the choppiness in December provided a healthy reset of sentiment and positioning, which became too extended following the U.S. election in November, Orton said. While the S&P 500 Index pulled back only about 4%, the average stock was down nearly 10% with 10-year U.S. Treasury yields up over 60 basis points to 4.8%.1
“I have long advocated for using downside opportunistically, and I believe investors were presented with an attractive opportunity this month to consider deploying some capital across both equities and fixed income,” he said. “The flurry of policy announcements and social media grenades are just getting started, and I expect them to move markets with expectations quite positive around tariffs, taxes, and the deregulatory agenda. This increased volatility highlights why I believe diversification and selectivity will be so important, and why I also believe it’s so important to think about leaning into the long-term secular growth mega-trends that are already firmly in place.”
These include the hundreds of billions of dollars of private capital being spent on artificial intelligence, but also on reshoring and diversifying supply chains and modernizing the power grid. These mega-trends, Orton believes, are bipartisan in nature and offer the new administration an opportunity to fuel the momentum that already exists.
“There are certainly near-term risks, including another potential backup in rates, renewed strength in the dollar, and surprising tariff policy,” he said. “But I do not think these risks ultimately will derail the strength of corporate earnings or meaningfully cut into margins, nor should they change the strength of the labor market and American consumer. Consequently, I believe investors should consider leveraging any downside opportunistically; think about potential ways to diversify across asset classes, market capitalizations, and geographies; and evaluate whether to lean into the mega-trends that I expect to drive growth in the long-term.”
Earnings growth is the key reason Orton has been so persistently optimistic on the market over the past two years. Earnings growth emerged from a recession in 2022, first for the mega-cap technology companies. Now it has started to broaden across sectors over the past few quarters. This increase in breadth continues to play out, and Orton expects that the results for the fourth quarter of 2024 could help sustain a further broadening. This could help tie further market gains to earnings growth, rather than to multiple expansion, he said. So far for the fourth quarter, the blended year-over-year earnings growth rate for the S&P 500 stands at 12.7% versus a consensus expectation of 11.8%. If that holds up, it would mark the highest earnings growth rate since the fourth quarter of 2021.
Not a bad start to the year...
2025 year-to-date S&P 500 sector returns through 1/24/2025
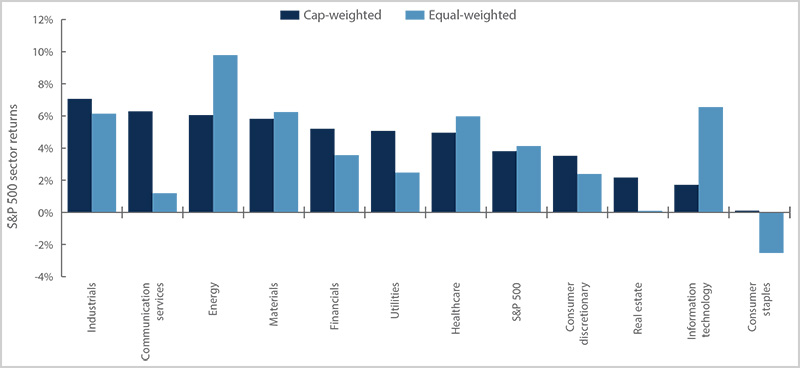
Source: Bloomberg, as of 1/24/25.
Margins also are holding strong despite concerns about inflation. This quarter marks the third consecutive quarter that the S&P 500 is reporting a net profit margin above 12%, and expectations are for margins to expand in 2025.
“I believe it will be critical to see margins remain strong, especially as we head into an uncertain environment with respect to tariffs,” Orton said. Going forward, he also plans to pay close attention to the outlook for sales growth against a backdrop of moderating nominal gross domestic product (GDP) and a strengthening dollar. Most mega-cap companies will report earnings over the next two weeks, and Orton said continued resiliency will be important as these stocks have been somewhat of a ballast for the market.
It’s tough to talk about earnings and mega-trends without also spending some time on capital expenditures (capex), particularly with respect to artificial intelligence (AI). Recent weeks have brought many reports on AI spending, including positive reinforcement last week from the largest chip manufacturer about continued capex within semiconductors. We also got a splashy multi-partner announcement of the Stargate Project, which promises $500 billion in spending over the next four years on AI infrastructure, though where that funding comes from is still to be announced. Upwards of $100 billion more in AI-related capex has been announced by players in the United States, China, and India. While many of these plans are still somewhat theoretical, Orton said all are directionally positive.
“We also can’t forget about the likelihood that we see a traditional infrastructure capex announcement over the coming months through Congress or the Trump administration,” he said. “All of this speaks to further support for U.S. exceptionalism and the opportunity for investing across the market. Not all companies will benefit, either, which is why I believe that selectivity is so important. But this kind of spending on a wide range of projects helps to keep earnings growing and people employed. And it’s a key reason why I find it difficult to turn bearish over the longer term as we live through periods of market consolidation.”
We’re returning to an environment, at least in the near term, where there’s an incessant focus on every announcement from President Trump or his administration. And that focus has caused, and will continue to cause, wobbles up and down in the market.
“I don’t believe long-term investors should react to every wobble, nor should they allow themselves to be overly worried or enthusiastic about any single headline,” Orton said. “We have to tune out the noise and assess how the direction and totality of these headlines will impact the outlook for earnings. The good news right now is that we’re heading into the peak of the earnings season, and that should help to offset any near-term noise. This week will be particularly important to see if the mega-cap complex will continue delivering on earnings.”
While the market has recovered nicely from its consolidation over the past month, there are still some near-term risks to monitor – the most significant of which concern tariffs. While some of the recent proclamations around tariffs on China have been encouraging, there hasn’t been as much encouraging news around Canada and Mexico. Ultimately, Orton said, we just don’t know what will be implemented and what the end result will be after negotiations. Therefore, we don’t know what the impacts will be. Orton does have concerns that investors may be celebrating too early with respect to recent headlines and the lack of formal tariff announcements to date. Given that President Trump largely leveraged tariffs as a negotiating tactic during his first term, Orton said investors may be underestimating the potential for more substantive tariffs in his second term. This is another reason why he likes thinking about leaning into key secular growth trends to guide investments. His ideas about areas to consider include:
Small caps are more than an interest rate story. The summer rally in small caps was partly based on the view that the U.S. Federal Reserve (Fed) would cut rates steadily to 3% or below, helping smaller companies that are more exposed to floating rates. The repricing of rate cut expectations led to a post-election selloff that Orton said missed the forest for the trees. The most important issue for smaller companies is not the cost of their debt finance, which represents about 2.3% of their sales, but instead the underlying strength of their businesses, measured by operating margins and sales growth. Rate expectations have risen because of expectations for continued economic growth, which translates into a return to sales growth for smaller companies. Interest costs are only about 2.3% of sales and are expected to remain stable as financing costs are more closely linked to shorter-term rates. If sales increase while financing costs remain relatively stable, there could be a supportive leverage effect to margins and earnings per share (EPS). “The market is totally missing this,” Orton said, “and I believe a constructive earnings season could provide a catalyst to finally see some sustainable small-cap outperformance over the broader market.”
Continue to think about secular growth mega-trends. Prior to the election, Orton counseled against positioning around the noise. Instead, he favored focusing on the long-term drivers of growth, particularly bipartisan priorities. Along with the capex beneficiaries from the AI buildout, Orton sees potential opportunities in areas exposed to reshoring trends, plus global aerospace and defense. Market dips can typically provide good entry points, and he expects to see these drivers of macroeconomic growth continue to translate into increasing EPS growth and steady or expanding margins. The key, he said, is not chasing these trades higher, but rather considering whether to leverage episodes of volatility. Earnings season will provide investors with an updated scorecard, he said, punishing the companies where reality has failed to live up to hype.
Stocks hit a series of all-time highs last week, helped by positive earnings, as bonds drifted sideways. Orton said further gains will rest on a big week of earnings reports as well as any surprises from this week’s meeting of the Federal Open Market Committee (FOMC). Fed Chair Jerome Powell likely will be asked about how the committee is looking at the recent easing in financial conditions with the more risk-on tone in the markets as well as Fed Governor Christopher Waller’s more dovish outlook and whether Powell himself has changed his own views. In the end, Orton expects the meeting results to be a non-event with Powell taking a “get out of there quick” approach, keeping comments short and not notably more dovish than December’s hawkish tone. On the earnings front, investors will hear from four of the biggest companies by market capitalization in the S&P 500.
1 Unless otherwise indicated, all data cited is sourced from Bloomberg as of Jan. 24, 2025.
Risk Information:
Investing involves risk, including risk of loss.
Diversification does not ensure a profit or guarantee against loss.
Disclosures:
Index or benchmark performance presented in this document does not reflect the deduction of advisory fees, transaction charges, or other expenses, which would reduce performance. Indexes are unmanaged. It is not possible to invest directly in an index. Any investor who attempts to mimic the performance of an index would incur fees and expenses that would reduce return.
This document is a general communication being provided for informational purposes only. It is educational in nature and not designed to be taken as advice or a recommendation for any specific investment product, strategy, plan feature, or other purpose in any jurisdiction, nor is it a commitment from Raymond James Investment Management or any of its affiliates to participate in any of the transactions mentioned herein. Any examples used are generic, hypothetical, and for illustration purposes only. This material does not contain sufficient information to support an investment decision, and you should not rely on it in evaluating the merits of investing in any securities or products. In addition, users should make an independent assessment of the legal, regulatory, tax, credit, and accounting implications and make their own determinations together with their own professionals in those fields. Any forecasts, figures, opinions, or investment techniques and strategies set out are for information purposes only, based on certain assumptions and current market conditions, and are subject to change without prior notice. All information presented herein is considered to be accurate at the time of production, but no warranty of accuracy is given and no liability in respect of any error or omission is accepted. It should be noted that investment involves risks, the value of investments and the income from them may fluctuate in accordance with market conditions and taxation agreements, and investors may not get back the full amount invested. Both past performance and yields are not reliable indicators of current and future results.
The views and opinions expressed are not necessarily those of the broker/dealer or any affiliates. Nothing discussed or suggested should be construed as permission to supersede or circumvent any broker/dealer policies, procedures, rules, and guidelines.
Sector investments are companies engaged in business related to a specific sector. They are subject to fierce competition and their products and services may be subject to rapid obsolescence. There are additional risks associated with investing in an individual sector, including limited diversification.
Investing in small cap stocks generally involves greater risks, and therefore, may not be appropriate for every investor. The prices of small company stocks may be subject to more volatility than those of large company stocks.
International investing presents specific risks, such as currency fluctuations, differences in financial accounting standards, and potential political and economic instability. These risks are further accentuated in emerging market countries where risks can also include possible economic dependency on revenues from particular commodities or on international aid or development assistance, currency transfer restrictions, and liquidity risks related to lower trading volumes.
Diversification does not ensure a profit or guarantee against a loss.
Definitions
American exceptionalism is an idea centered on the notion that the United States is a unique and even superior nation as a result of historical, ideological, religious, and/or, in the context of finance, economic reasons. Proponents of American exceptionalism often expect or advocate for the United States to occupy or play a leading role in global affairs.
Backup refers to an unfavorable change in bond interest rates.
Ballast, in finance, can refer to characteristics, factors or trading strategies that mitigate volatility or provide stability to a security or group of securities.
Basis points (bps) are measurements used in discussions of interest rates and other percentages in finance. One basis point is equal to 1/100th of 1%, or 0.01%.
Blended earnings combine actual results for companies that have reported earnings and estimated results for companies that have yet to report.
Breadth describes the relationship between the median and the mean of a market index. When a few data outliers result in a mean that is substantially larger (or smaller) than the median of the full data set, then the performance of the entire index is being driven by a “narrow” selection of companies. An index supported by “broad” market movements is one where the median is closer to the mean.
Capital expenditures, or capex, are monies used by a company to buy, improve, or maintain physical assets such as real estate, facilities, technology, or equipment, and may include new projects or investments.
Consolidation is a term used in technical analysis to describe when stocks reverse previous gains (or losses) to stay within well-defined trading levels.
Cyclical stocks have prices influenced by macroeconomic changes in the economy and are known for following the economy as it cycles through expansion, peak, recession, and recovery.
Dovish, hawkish, and centrist are terms used to describe the monetary policy preferences of central bankers and others. Doves tend to support maintaining lower interest rates, often in support of stimulating job growth and the economy more generally. Hawks prioritize controlling inflation and may favor raising interest rates to reduce it or keep it in check. Centrists tend to occupy the middle of the continuum between tight (hawkish) and loose (dovish) monetary policy.
Earnings per share (EPS) is calculated as a company’s profit divided by the outstanding shares of its common stock. The resulting number serves as an indicator of a company’s profitability.
The Federal Open Market Committee (FOMC) consists of 12 members: the seven members of the Board of Governors of the Federal Reserve System; the president of the Federal Reserve Bank of New York; and four of the remaining 11 Reserve Bank presidents, who serve one-year terms on a rotating basis. The FOMC holds eight regularly scheduled meetings per year at which it reviews economic and financial conditions, determines the appropriate stance of monetary policy, and assesses the risks to its long-run goals of price stability and sustainable economic growth.
Floating rate debt refers to debts with variable rates of interest, which are often tied to benchmark rates of interest such as U.S. Treasury note yields or the federal funds rate.
Gross domestic product (GDP) is the total value of goods and services provided in an economy during a specified period, often one quarter or one year. Nominal GDP reflects the value unadjusted for inflation.
Market capitalization, or market cap, refers to the total dollar market value of a company’s outstanding shares of stock.
Mega-cap stocks are the largest publicly traded companies as measured by market capitalization. Generally, this refers to companies with market capitalizations over $200 billion.
A megatrend is a widespread and long-term macroeconomic, technological, social, environmental, political, or other change that may develop slowly at first but that has a major, ongoing impact once it gets underway. Megatrends are distinct from smaller trends in business, economic, or other spheres of activity that have less far-reaching or enduring effects.
A multiple, sometimes referred to as the price multiple or earnings multiple, is a measure of a company’s value based on the ratio of its current share price to its earnings per share. This ratio is known as the price-to-earnings ratio, or P/E.
Multiple expansion occurs when a stock’s multiple rises, in some cases faster than the stock’s fundamental value. Multiple expansion creates arbitrage opportunities for investors who have bought the stock at the lower multiple value.
A net profit margin, often shortened to net margin, measures how much net income or profit a company generates as a percentage of revenue. It can be expressed as a percentage or a decimal.
Operating margin measures how much profit a company makes on a dollar of sales after paying for production costs such as wages and raw materials, but before paying interest or tax. It is calculated by dividing a company’s operating income by its net sales.
Positioning refers to assessments of whether professional investors are, on the whole, bullish or bearish on a particular security, industry, sector, market capitalization or other area of the market, as reflected by the extent to which they are invested in the area of the market in question.
Risk-on sentiment is typically fueled by a strong growth environment in which good news supports a bullish outlook and investor expectations of favorable risk/reward ratios.
Reshoring describes an effort to bring manufacturing and other services back to the United States from overseas operations.
Indices
The S&P 500 Index measures changes in stock market conditions based on the average performance of 500 widely held common stocks. It is a market-weighted index calculated on a total return basis with dividend reinvested. The S&P 500 represents approximately 80% of the investable U.S. equity market.
The S&P 500® Equal Weight Index is the equal-weight version of the S&P 500. It includes the same constituents as the capitalization-weighted S&P 500, but each company in the S&P 500 Equal Weight Index is allocated a fixed weight, or 0.2% of the index total at each quarterly rebalance.
The S&P 500® Industrials comprises those companies included in the S&P 500 that are classified as members of the GICS® industrials sector.
The S&P 500® Equal Weight Industrials Index imposes equal weights on the index constituents included in the S&P 500 that are classified in the GICS® industrials sector.
The S&P 500® Communication Services comprises those companies included in the S&P 500 that are classified as members of the GICS® communication services sector.
The S&P 500® Equal Weight Communication Services Index imposes equal weights on the index constituents included in the S&P 500 that are classified in the GICS® communication services sector.
The S&P 500® Energy comprises those companies included in the S&P 500 that are classified as members of the GICS® energy sector.
The S&P 500® Equal Weight Energy Index imposes equal weights on the index constituents included in the S&P 500 that are classified in the GICS® energy sector.
The S&P 500® Materials comprises those companies included in the S&P 500 that are classified as members of the GICS® materials sector.
The S&P 500® Equal Weight Materials Index imposes equal weights on the
index constituents included in the S&P 500 that are classified in the GICS® materials sector.
The S&P 500® Financials comprises those companies
The S&P 500® Equal Weight Financials Index imposes equal weights on the index constituents included in the S&P 500 that are classified in the GICS® financials sector.
The S&P 500® Utilities comprises those companies included in the S&P 500 that are classified as members of the GICS® utilities sector.
The S&P 500® Equal Weight Utilities Index imposes equal weights on the index constituents included in the S&P 500 that are classified in the GICS® utilities sector.
The S&P 500® Health Care Index comprises those companies included in the S&P 500 that are classified as members of the GICS® health care sector.
The S&P 500® Equal Weight Index Health Care Index imposes equal weights on the index constituents included in the S&P 500 that are classified in the GICS® health care sector.
The S&P 500® Consumer Discretionary comprises those companies included
in the S&P 500 that are classified as members of the GICS® consumer discretionary sector.
The S&P 500® Equal Weight Consumer Discretionary Index imposes equal weights on the index constituents included in the S&P 500 that are classified in the GICS® consumer discretionary sector.
The S&P 500® Real Estate comprises those companies included in the S&P 500 that are classified as members of the GICS® Real Estate sector.
The S&P 500® Equal Weight Real Estate Index is designed to impose equal weights on the index constituents included in the S&P 500 that are classified in the GICS® real estate sector, excluding mortgage REITs.
The S&P 500® Information Technology Index comprises those companies included in the S&P 500 that are classified as members of the GICS® information technology sector.
The S&P 500® Equal Weight Information Technology Index imposes equal weights on the index constituents included in the S&P 500 that are classified in the GICS® information technology sector.
The S&P 500® Consumer Staples comprises those companies included in the S&P 500 that are classified as members of the GICS® consumer staples sector.
The S&P 500® Equal Weight Consumer Staples Index imposes equal weights on the index constituents included in the S&P 500 that are classified in the GICS® consumer staples sector.
M-680815 Exp. 5/27/2025
