“
”Markets in Focus
Timely analysis of market moves and sectors of opportunity
Look for recent divergences in equity performance to continue at least into early 2025.
This underscores the importance of being selective.
Areas to watch include small caps, cyclicals, and global banks.
The stock market has seen some significant divergences in performance this quarter.
Watch these closely, says Matt Orton, CFA, Chief Market Strategist at Raymond James Investment Management. He believes they could present potential opportunities in select sectors, market capitalizations, and geographies through at least the start of 2025.
Financials and energy have dramatically outperformed while healthcare has gone from bad to worse.1 There’s nearly a 20% difference between financials and healthcare quarter to date: +11.74% versus -6.56%. Both money center and regional banks posted strong numbers overall and surged higher following the election on optimism around a more favorable regulatory environment going forward. Healthcare results were actually pretty good, but that wasn’t enough to overcome negative sentiment around pharmaceuticals followed by concerns over the regulatory environment under the incoming Trump administration.
Small caps continue to lead large caps following the election, supported by the strength in banks and earnings trends that are finally starting to look more favorable.
International equities have further diverged from U.S. stocks, lagging consistently throughout the quarter with underperformance accelerating after the elections. The MSCI EAFE® (Net) Index is underperforming the S&P 500 Index by more than 11% quarter to date, and Orton said there just doesn’t seem to be any good news coming.
“I don’t think we’re going to see a reversion to the mean in the near future since many of these trends likely won’t stop until we get some policy clarity following President-elect Donald Trump’s inauguration in January,” Orton said. “But that doesn’t mean there aren’t opportunities for investors. Consider leaning into what’s working, but also watch for opportunities to take advantage of the divergences across the market.”
Don’t wait for the rising tide to lift all boats
3-month implied correlation of returns for the 50 biggest companies in the S&P 500
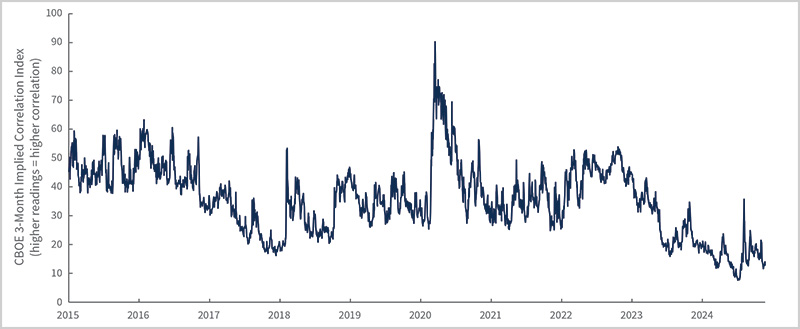
Source: Bloomberg and Chicago Board Options Exchange (CBOE) 3-Month Implied Correlation Index, as of 11/22/24. Higher readings reflect higher correlation of returns for stocks selected.
Implied correlation on the S&P 500 is near the lowest level over the past decade, which Orton said means micro-level details matter. There is significant dispersion at the industry and company level. He said market pullbacks give investors an opening to think about exploring these various opportunities in an effort to diversify portfolios as breadth continues to expand.
“I expect improving breadth and earnings growth to support the markets into 2025,” Orton said, “but I believe selectivity will be increasingly important since I expect that what you own will matter more in 2025.”
One of the most notable divergences recently has been the outperformance of U.S. equities, particularly relative to Europe, Orton said. Recent trends in survey data highlight stark contrasts between the economic environments of the United States and Europe. In the months leading up to the election, survey data in the United States showed a large spike in uncertainty. But that has quickly reversed: Last week there was a big jump higher in the 6-month-ahead outlook in the Federal Reserve Bank of Philadelphia’s Manufacturing Business Survey, while the November U.S. composite Purchasing Managers’ Index was more optimistic than expected.
This was in stark contrast to the deterioration of sentiment in Europe, which increasingly looks consistent with stagflation. Orton believes, however, there are some attractive opportunities for selective investors to consider in Europe. There has actually been an earnings recovery in the STOXX® Europe 600 Index led by financials, which have posted earnings growth of 26% and have been the biggest contributors to the overall European earnings growth rate. Orton has favored global banks for a while, and this includes many in Europe, particularly those on the periphery of the continent where economic growth is better than in the core. There has also been a recovery in European utilities and healthcare companies. He said it’s worth noting that Europe is only one component of international markets, and other regions like Japan have held up relatively well and also can benefit from significant fiscal packages.
One of the most common questions Orton has gotten over the past few weeks is whether these divergences can continue.
“I do think there is durability to some of the trends that we’ve seen play out, at least in the short term,” he said. “Some assumptions regarding deregulation, reshoring, increased investment, and lower taxes in Trump 2.0 seem reasonable and should lead to higher earnings going forward. This is a key reason why I remain so positive on banks and industrials, particularly aerospace and defense.”
As earnings continue to broaden, Orton said these parts of the market can see earnings per share growth continue to move higher. However, he said the market should also take President-elect Trump’s proposed policies both seriously and literally. His appointments and rhetoric certainly signal his desire to implement large parts of the economic agenda upon which he campaigned, including significant tariffs. As these policies are pushed forward in 2025, Orton expects the path for implementation will likely not be as smooth as the market assumes. He expects to see increased volatility earlier in the year.
“The reality of more serious tariffs will also start to set in, and there’s probably more questions than answers, at least at the start, further contributing to uncertainty at the start of the year,” he said. “That is why I believe investing in higher-quality companies will be increasingly important.”
There is a lot of positive momentum across the market, and Orton believes “policy is stimulative and is set to become more stimulative in coming years.”
Small caps are breaking out of a four-year consolidation while the average stock in the S&P 500 continues to push to all-time highs. As we conclude another earnings season, there isn’t going to be much to drive the market from a fundamental perspective outside of economic data and the December meeting of the Federal Open Market Committee (FOMC). Orton said that means the market likely drifts higher, with some volatility around data releases where any downside could be an opportunity to evaluate. Trends from third-quarter earnings are generally positive. This is particularly important since the economic growth-versus-inflation tradeoff, which drives price-to-earnings (P/E) multiples, will be tough to improve upon, Orton said.
“Any dramatic increase in economic growth is likely to be accompanied by higher inflation, meaning that earnings will be critical to the market,” he said. “And this also means that selectivity becomes even more important in a world where company fundamentals matter and the rising tide can no longer lift all boats. And while the S&P 500 has hit over 50 all-time highs this year, I believe there are still plenty of opportunities for investors to consider.” They include:
Small caps. Orton believes that small caps’ recent outperformance can continue. The Russell 2000® Index has been making a series of higher highs and higher lows, with a meaningful breakout following the election on expectations of deregulation, optimism about growth, and a steepening yield curve, which has supported regional banks. While higher interest rates in the near term are a concern to follow closely, Orton thinks we’re still most likely to see a cut in December and additional cuts in 2025. He said the rate-cutting cycle should be supportive for smaller companies, and historically this has been associated with strong small-cap performance. He noted that high-yield credit spreads are also tight; balance sheets are generally in good shape with companies holding near-record levels of cash and reducing levels of debt; and small-cap earnings are finally expected to start catching up to large caps in 2025.
Cyclicals. Despite the likelihood of elevated volatility in early 2025, Orton believes that cyclicals can still outperform defensives. He sees them providing a hedge worth thinking about against sticky inflation and higher growth in U.S. gross domestic product (GDP). Earnings growth for cyclicals has been improving while valuations relative to defensives still look attractive, he said. While the recent rally has sentiment stretched in the near term, he said he would consider using downside opportunistically to broaden portfolios. Financials remain the sector where he would consider having an being overweight.
Global banks. Bank profitability has held up quite well and the U.S. credit default cycle looks to have peaked. In the Eurozone, there are pockets of economic resilience, especially in the periphery. These banks have performed well year to date, and Orton continues to expect them to outperform.
Small caps only 1.5% below their November 2021 all-time high
Russell 2000 Index since 2020
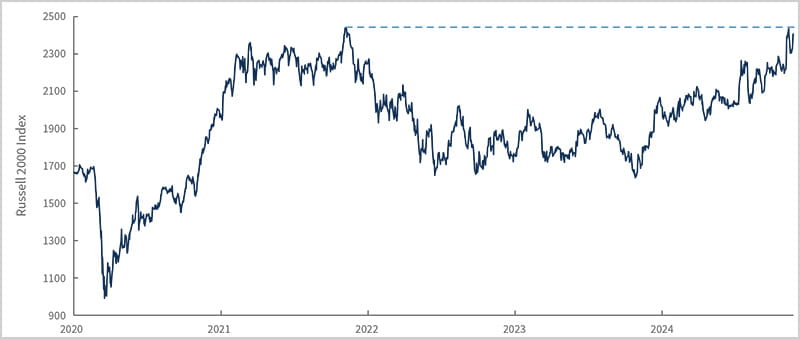
Source: Bloomberg, as of 11/22/24
Tuesday brings the minutes of the FOMC meeting in November.
Wednesday brings initial jobless claims, an update on U.S. GDP growth, and the core Personal Consumption Expenditures (PCE) Price Index, along with other personal income data for October.
1 Unless otherwise indicated, all data cited is sourced from Bloomberg as of Nov. 22, 2024.
Risk Information:
Investing involves risk, including risk of loss.
Diversification does not ensure a profit or guarantee against loss.
Disclosures:
Index or benchmark performance presented in this document does not reflect the deduction of advisory fees, transaction charges, or other expenses, which would reduce performance. Indexes are unmanaged. It is not possible to invest directly in an index. Any investor who attempts to mimic the performance of an index would incur fees and expenses that would reduce return.
This document is a general communication being provided for informational purposes only. It is educational in nature and not designed to be taken as advice or a recommendation for any specific investment product, strategy, plan feature, or other purpose in any jurisdiction, nor is it a commitment from Raymond James Investment Management or any of its affiliates to participate in any of the transactions mentioned herein. Any examples used are generic, hypothetical, and for illustration purposes only. This material does not contain sufficient information to support an investment decision, and you should not rely on it in evaluating the merits of investing in any securities or products. In addition, users should make an independent assessment of the legal, regulatory, tax, credit, and accounting implications and make their own determinations together with their own professionals in those fields. Any forecasts, figures, opinions, or investment techniques and strategies set out are for information purposes only, based on certain assumptions and current market conditions, and are subject to change without prior notice. All information presented herein is considered to be accurate at the time of production, but no warranty of accuracy is given and no liability in respect of any error or omission is accepted. It should be noted that investment involves risks, the value of investments and the income from them may fluctuate in accordance with market conditions and taxation agreements, and investors may not get back the full amount invested. Both past performance and yields are not reliable indicators of current and future results.
The views and opinions expressed are not necessarily those of the broker/dealer or any affiliates. Nothing discussed or suggested should be construed as permission to supersede or circumvent any broker/dealer policies, procedures, rules, and guidelines.
Sector investments are companies engaged in business related to a specific sector. They are subject to fierce competition and their products and services may be subject to rapid obsolescence. There are additional risks associated with investing in an individual sector, including limited diversification.
Investing in small cap stocks generally involves greater risks, and therefore, may not be appropriate for every investor. The prices of small company stocks may be subject to more volatility than those of large company stocks.
International investing presents specific risks, such as currency fluctuations, differences in financial accounting standards, and potential political and economic instability. These risks are further accentuated in emerging market countries where risks can also include possible economic dependency on revenues from particular commodities or on international aid or development assistance, currency transfer restrictions, and liquidity risks related to lower trading volumes.
Definitions
Breadth describes the relationship between the median and the mean of a market index. When a few data outliers result in a mean that is substantially larger (or smaller) than the median of the full data set, then the performance of the entire index is being driven by a “narrow” selection of companies. An index supported by “broad” market movements is one where the median is closer to the mean.
A breakout takes place when an index level or asset price rises above a resistance level (a price point that the metric in question has had trouble exceeding in the time period being considered) or a drops below a support level (the price at which buyers tend to enter the market).
Consolidation is a term used in technical analysis to describe when stocks reverse previous gains (or losses) to stay within well-defined trading levels.
Core PCE, officially known as the Personal Consumption Expenditures (PCE) excluding Food and Energy, Price Index, is a measure of the prices that U.S. consumers pay for goods and services, not including two categories – food and energy – where prices tend to swing up and down more dramatically and more often than other prices. The core PCE price index, released monthly by the U.S. Department of Commerce Bureau of Economic Analysis, measures inflation trends and is watched closely by the U.S. Federal Reserve as it conducts monetary policy.
Correlation is a statistic that measures the degree to which two securities move in relation to each other.
A credit spread is the difference in yield between a U.S. Treasury bond and another debt security with the same maturity but different credit quality. Also referred to as “bond spreads” or “default spreads,” credit spreads are measured in basis points, with a 1% difference in yield equaling a spread of 100 basis points. Credit spreads reflect the risk of the debt security being compared with the Treasury bond, which is considered to be risk-free. Higher quality securities have a lower chance of the issuer defaulting. Lower quality securities have a higher chance of the issuer defaulting.
Cyclical stocks have prices influenced by macroeconomic changes in the economy and are known for following the economy as it cycles through expansion, peak, recession, and recovery.
Defensive stocks provide consistent dividends and stable earnings regardless of whether the overall stock market is rising or falling. Companies with shares considered to be defensive tend to have a constant demand for their products or services and thus their operations are more stable during different phases of the business cycle.
Earnings per share (EPS) is calculated as a company’s profit divided by the outstanding shares of its common stock. The resulting number serves as an indicator of a company’s profitability.
The Federal Open Market Committee (FOMC) consists of 12 members: the seven members of the Board of Governors of the Federal Reserve System; the president of the Federal Reserve Bank of New York; and four of the remaining 11 Reserve Bank presidents, who serve one-year terms on a rotating basis. The FOMC holds eight regularly scheduled meetings per year at which it reviews economic and financial conditions, determines the appropriate stance of monetary policy, and assesses the risks to its long-run goals of price stability and sustainable economic growth.
The Federal Reserve Bank of Philadelphia’s Manufacturing Business Outlook Survey is a monthly survey in which manufacturers in the Third Federal Reserve District, which includes Pennsylvania, New Jersey, and Delaware, indicate the direction of change in overall business activity and in various measures of activity at their plants: employment, working hours, new and unfilled orders, shipments, inventories, delivery times, prices paid, and prices received.
Fiscal policy refers to the tax collection and spending a government uses to influence its country’s economy.
Gross domestic product (GDP) is the total value of goods and services provided in an economy during a specified period, often one year.
A hedge is an investment or investment strategy that is designed to lessen the potential for losses in other investments. The price of an investment considered to be a hedge often moves in the opposite direction of the prices of the investments being hedged.
High-yield bonds pay higher interest rates because they have lower credit ratings than investment-grade bonds. High-yield bonds have credit ratings below BBB- from Standard & Poor’s or below Baa3 from Moody’s.
Implied correlation is a measure of how closely the components of a given index track against one another.
Market capitalization, or market cap, refers to the total dollar market value of a company’s outstanding shares of stock.
Money center banks are large banks situated in economic hubs that primarily deal with governments, other banks, and big corporations.
A multiple, sometimes referred to as the price multiple or earnings multiple, is a measure of a company’s value based on the ratio of its current share price to its earnings per share. This ratio is known as the price-to-earnings ratio, or P/E.
Overweight describes a portfolio position in an industry sector or some other category that is greater than the corresponding weight level in a benchmark portfolio.
Price-to-earnings (P/E) ratios measure a company’s current share price relative to its earnings per share. The ratio is used to help assess a company’s value and is sometimes referred to as the price multiple or earnings multiple.
The Purchasing Managers’ Index (PMI), produced by the Institute for Supply Management (ISM), measures the prevailing direction of economic trends in the manufacturing sector. It consists of an index summarizing whether market conditions as reported in a monthly survey of supply chain managers are expanding, staying the same, or contracting.
Reshoring describes an effort to bring manufacturing and other services back to the United States from overseas operations.
Reversion to the mean, or mean reversion, refers to the statistical tendency of data to rise or fall toward its long-term average over time.
Stagflation, first described after the oil shocks of the 1970s, is an economic condition that includes slow economic growth (or even declines in gross domestic product), relatively high unemployment, and inflation.
Sticky is a term used to describe measured data that is slow to change, in contrast to faster-changing or more variable data.
A yield curve is a line that plots yields (interest rates) of bonds having equal credit quality but differing maturity dates. The slope of the yield curve gives an idea of future interest rate changes and economic activity. A steepening yield curve results from a widening in the difference between short- and long-term interest rates. A steepening curve often reflects an expectation of stronger economic activity, rising inflation and rising interest rates.
Indices
The S&P 500 Index measures change in stock market conditions based on the average performance of 500 widely held common stocks. It is a market-weighted index calculated on a total return basis with dividend reinvested. The S&P 500 represents approximately 80% of the investable U.S. equity market.
The Chicago Board Options Exchange (CBOE) 3-Month Implied Correlation Index, a gauge of herd behavior, reflects the market’s expectation of future diversification. It measures the average expected correlation benefits over a three-month window between the top 50 stocks in the S&P 500 Index.
The MSCI EAFE® (Net) Index measures the performance of performance of large and mid-cap securities across 21 developed markets, including countries in Europe, Australasia and the Far East, excluding the U.S. and Canada. The MSCI EAFE® (Net) Index subtracts any foreign taxes applicable to US citizens but not applicable to citizens in the overseas country.
The Russell 2000® Index measures the performance of the 2,000 smallest companies in the Russell 3000® Index, which represents approximately 7% of the total market capitalization of the Russell 3000® Index.
The STOXX® Europe 600 Index represents 600 large-, mid- and small-capitalization companies across 17 European countries: Austria, Belgium, Denmark, Finland, France, Germany, Ireland, Italy, Luxembourg, the Netherlands, Norway, Poland, Portugal, Spain, Sweden, Switzerland, and the United Kingdom.
London Stock Exchange Group plc and its group undertakings (collectively, the “LSE Group”). ©LSE Group 2024. FTSE Russell is a trading name of certain of the LSE Group companies. Russell® is a trademark of the relevant LSE Group companies and is used by any other LSE Group company under license. All rights in the FTSE Russell indexes or data vest in the relevant LSE Group company which owns the index or the data. Neither LSE Group nor its licensors accept any liability for any errors or omissions in the indexes or data and no party may rely on any indexes or data contained in this communication. No further distribution of data from the LSE Group is permitted without the relevant LSE Group company’s express written consent. The LSE Group does not promote, sponsor, or endorse the content of this communication.
M-648049 Exp. 3/25/2025
