“
”Markets in Focus
Timely analysis of market moves and sectors of opportunity
The probability of the United States entering a recession is falling, but the probability of inflation reaccelerating is rising.
The next two weeks will be highly consequential, with many key earnings releases, forthcoming economic data, the presidential election, and the Federal Open Market Committee meeting on Nov. 7.
Themes to consider in this environment: Cyclicality. Small caps. India.
The next two weeks are effectively the Super Bowl of investing. Key earnings reports and data releases will lead right into the U.S. election, with the next Federal Open Market Committee meeting soon after.
“Buckle up,” said Joey Del Guercio, Market Strategy Research Associate at Raymond James Investment Management. “I believe volatility is likely to increase.”
In the meantime, markets are in a bit of limbo. The S&P 500 Index declined by 0.96% last week, snapping its streak of six consecutive weekly gains while the tech-heavy Nasdaq Composite Index eked out a 0.16% gain for its seventh weekly gain in a row on the back of mega-cap technology stocks.1 The expansion of breadth stalled: The Magnificent Seven rose 3.49%, while the S&P 500® Equal Weight Index and the S&P 493, which is the rest of the S&P 500 minus the Magnificent Seven, each declined roughly 2%, and the Russell 2000® Index fell 2.99%. The soft-landing narrative continues to materialize as the consensus base case, but questions are reigniting about the path for interest rate cuts going forward.
Somewhat counterintuitively, interest rates are higher now than they were when the U.S. Federal Reserve (Fed) cut the federal funds rate on Sept. 18. The 10-year U.S. Treasury yield went from 3.65% the day before the 50-basis point cut to 4.24% now, an increase of 59 basis points.
So why is that?
“Essentially, the probability of the United States entering a recession is fading, but the probability of inflation reaccelerating is increasing,” Del Guercio said. The Fed has a dual mandate — maximum employment and stable prices — and interest rates were originally raised this cycle to squash the inflation induced by the COVID-19 pandemic and zero interest-rate policy (ZIRP). So, the soft-landing scenario is the one in which the Fed brings down inflation to its 2% target via restrictive monetary policy (higher rates) without sputtering economic growth enough to send the economy into a recession. Now, with economic data continuing to surprise to the upside, investors are beginning to question if the Fed really needs to cut rates and stimulate more growth leading to more inflation down the line. Last week, the S&P Global Flash U.S. Composite PMI® purchasing manager indexes came in ahead of estimates while initial jobless claims came in at the lowest level in a month, corroborating that growth and the labor market are holding up better than expected. There’s also some political noise around inflation’s stickiness and potential reignition.
“As former President Donald Trump’s odds of winning continue to rise, so does the odds of his policies being enacted,” Del Guercio said. “Of those, tariffs, tax cuts, and the curbing of immigration are inherently inflationary.”
Additionally, the growing U.S. deficit is another argument for inflation down the road with the United States now paying more on its interest payments annually than it does on defense.
“Inflation might be the easiest way out,” Del Guercio said. “That said, I caution against being a deficit-doomer considering that it hasn’t paid well to date to wait on the sidelines for something to happen. Higher rates aren’t the end of the world, and equities certainly haven’t needed rates to go lower as performance has been blistering. I believe interest rate expectations can continue to adjust toward a higher for longer future without it being detrimental to equities broadly.”
Last week was the first week of the two-week peak in the S&P 500’s third-quarter earnings season, and results continued to be broadly positive. Roughly 37% of the index has reported to date, and of those who have reported, 75% have posted a positive earnings per share (EPS) surprise while 59% have reported a positive revenue surprise. While expectations remain for this quarter to be the S&P 500’s slowest quarter of EPS growth since the second quarter of 2022, it will be the index’s fifth straight quarter of EPS growth and expectations remain for an earnings reacceleration featuring double-digit year-over-year earnings growth in each of 2025’s quarters.
The Great Rotation remains on solid footing
Performance of S&P 500 sectors vs. select indices, 7/10/24 to 10/25/24

Source: Bloomberg, as of 10/25/2024.
A major electric vehicle company kicked off the Magnificent Seven’s earnings last week, smashing estimates, rising impressively following the report, and giving investors more reason for optimism heading into this week. Now most eyes will be on the five Magnificent Seven constituents who report earnings this week. While the Magnificent Seven are expected to post decelerating earnings growth, Del Guercio said it’s going from extraordinarily robust to still robust. Consensus expectations are currently for the S&P 500 to grow EPS by about 3.4% year over year in the third quarter, 98% of which is expected to come from the Magnificent Seven. The leading designer of advanced semiconductors used in artificial intelligence (AI) alone is expected to be 46% of the index’s earnings growth, and with its Magnificent Seven peers making up a majority of its revenues, investors may pay extra attention to the hyperscalers’ capital expenditures (capex) guidance and commentary concerning their building out of the AI ecosystem.
“I’d be very hesitant to recommend trading against this elite cohort,” Del Guercio said, “especially as it heads into earnings with trailing underperformance.”
With the next two weeks comes an enormous amount of new information that Del Guercio expects to shape the market narrative and drive performance going forward.
“More than anything, I believe investors need to consider being diversified heading into the end of the year,” he said. That is why he and his colleague, Chief Market Strategist Matt Orton, CFA, have talked so much about building balance in portfolios.
“And don’t try to naively play for any specific election outcome,” Del Guercio said. “It doesn’t work.”
After the next couple of weeks, he expects markets can look forward to positive seasonal trends and the unwinding of election hedges in the short term, followed by a robust growth outlook that he believes should support equities into 2025 and beyond. He said a correction, whether it be through price or time, should be viewed as a welcome opportunity to consider deploying capital into this strong economic backdrop. In that context, Del Guercio’s investment playbook focuses on what he sees as three key areas of opportunity:
Cyclicality. While defensive stocks have been in vogue over the past few quarters, the tailwinds that led to their outperformance have begun to sputter, bolstering the case for leaning into cyclicality going forward, he said. Recession fears have faltered with the outlook for a more robust economy reigniting concerns over the stickiness of inflation and prompting investors to question whether interest rates will be structurally higher for longer. Energy, insurance, and banks are the parts of the market most positively correlated to rising bond yields. Energy has been a laggard but has the added benefit of being a geopolitical hedge while financials have posted the largest third-quarter EPS beats (+9.4% in aggregate) as an S&P 500 sector, raising hopes for continued outperformance. Del Guercio said industrials look attractive with prospects for continued strong performance from aerospace and defense companies as global defense budgets rise, and electrical equipment companies riding the tailwinds from artificial intelligence and electrification.
Small caps. Small caps have yet to make a new all-time high since November 2021, but Del Guercio said they look primed to make up for lost time. Small caps continue to benefit from the soft-landing narrative’s materialization, while also getting a potential boost from the “Trump trade” — the idea that a Trump victory could bring policies that benefit certain industries — with expectations for deregulation and a capital markets boom auguring well for small caps. He said don’t forget that small caps are expected to come out of their multi-year earnings recession with expectations for the Russell 2000 to post its first quarter of EPS growth in the fourth quarter before accelerating ahead of large caps through 2025. When small caps eventually break out, Del Guercio said it could be rapid as underweight investors crowd in to a trade where they currently lack adequate exposure.
India. Del Guercio maintains that India continues to be the best long-term opportunity in emerging markets, and the Indian NIFTY 50 Index is currently in a rare but still shallow pullback. While India isn’t cheap, he said that’s for good reason: you have to pay up for growth. He said this country has “undeniable demographic tailwinds, especially compared to China,” and is a key beneficiary of supply chains getting repositioned away from China. Emerging markets are still broadly under-allocated to globally, and Del Guercio sees India as the most quality market within them.
Earnings: 169 S&P 500 companies are expected to report earnings this week, representing 44% of the index’s total market capitalization. The most attention will be paid to the five Magnificent Seven constituents that are scheduled to report. Additionally, important earnings insights on the state of the consumer and macroeconomic trends are likely to come from major companies in credit cards, healthcare, petroleum, semiconductors, fast-food, ride-hailing and food delivery, and more.
The labor market: the September Job Openings and Labor Turnover Survey (JOLTS) report comes out on Tuesday, the ADP® National Employment Report™ on Wednesday, and most importantly the non-farm payrolls report and unemployment rate is published Friday.
Growth and inflation: The first reading of third-quarter gross domestic product is released Wednesday, the Fed’s preferred inflation gauge — the Personal Consumption Expenditures (PCE) excluding Food and Energy, Price Index, or core PCE — comes out on Thursday, and the October Institute for Supply Management manufacturing Purchasing Managers’ Index arrives Friday.
Percent of S&P 500 sector by market cap reporting earnings per week
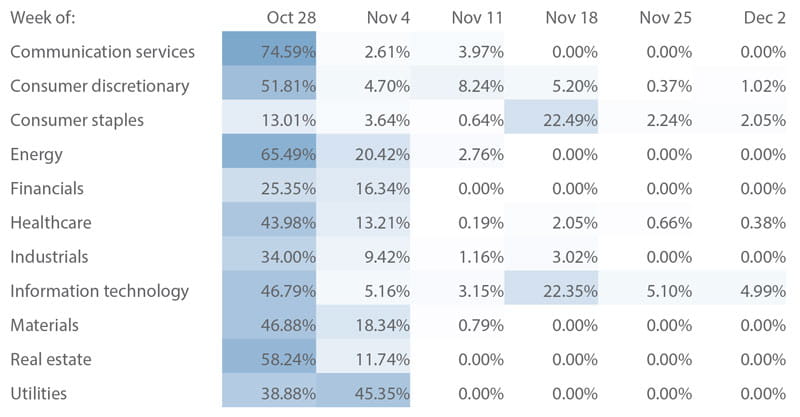
Source: Bloomberg, as of 10/28/2024.
1 Unless otherwise indicated, all data cited is sourced from Bloomberg as of Oct. 25, 2024.
Risk Information:
Investing involves risk, including risk of loss.
Diversification does not ensure a profit or guarantee against loss.
Disclosures:
Index or benchmark performance presented in this document does not reflect the deduction of advisory fees, transaction charges, or other expenses, which would reduce performance. Indexes are unmanaged. It is not possible to invest directly in an index. Any investor who attempts to mimic the performance of an index would incur fees and expenses that would reduce return.
This document is a general communication being provided for informational purposes only. It is educational in nature and not designed to be taken as advice or a recommendation for any specific investment product, strategy, plan feature, or other purpose in any jurisdiction, nor is it a commitment from Raymond James Investment Management or any of its affiliates to participate in any of the transactions mentioned herein. Any examples used are generic, hypothetical, and for illustration purposes only. This material does not contain sufficient information to support an investment decision, and you should not rely on it in evaluating the merits of investing in any securities or products. In addition, users should make an independent assessment of the legal, regulatory, tax, credit, and accounting implications and make their own determinations together with their own professionals in those fields. Any forecasts, figures, opinions, or investment techniques and strategies set out are for information purposes only, based on certain assumptions and current market conditions, and are subject to change without prior notice. All information presented herein is considered to be accurate at the time of production, but no warranty of accuracy is given and no liability in respect of any error or omission is accepted. It should be noted that investment involves risks, the value of investments and the income from them may fluctuate in accordance with market conditions and taxation agreements, and investors may not get back the full amount invested. Both past performance and yields are not reliable indicators of current and future results.
The views and opinions expressed are not necessarily those of the broker/dealer or any affiliates. Nothing discussed or suggested should be construed as permission to supersede or circumvent any broker/dealer policies, procedures, rules, and guidelines.
Sector investments are companies engaged in business related to a specific sector. They are subject to fierce competition and their products and services may be subject to rapid obsolescence. There are additional risks associated with investing in an individual sector, including limited diversification.
Investing in small cap stocks generally involves greater risks, and therefore, may not be appropriate for every investor. The prices of small company stocks may be subject to more volatility than those of large company stocks.
International investing presents specific risks, such as currency fluctuations, differences in financial accounting standards, and potential political and economic instability. These risks are further accentuated in emerging market countries where risks can also include possible economic dependency on revenues from particular commodities or on international aid or development assistance, currency transfer restrictions, and liquidity risks related to lower trading volumes.
Definitions
The ADP® National Employment Report™ is published monthly by the ADP Research Institute® in close collaboration with Moody’s Analytics. The ADP® National Employment Report™ provides a monthly snapshot of U.S. nonfarm private sector Employment based on actual transactional payroll data.
Basis points (bps) are measurements used in discussions of interest rates and other percentages in finance. One basis point is equal to 1/100th of 1%, or 0.01%.
A beat is when a company’s reported earnings or other business results exceed or are better than the expectations of analysts and others who follow the company’s stock.
Breadth describes the relationship between the median and the mean of a market index. When a few data outliers result in a mean that is substantially larger (or smaller) than the median of the full data set, then the performance of the entire index is being driven by a “narrow” selection of companies. An index supported by “broad” market movements is one where the median is closer to the mean.
Capital expenditures, or capex, are monies used by a company to buy, improve, or maintain physical assets such as real estate, facilities, technology, or equipment, and may include new projects or investments.
A consensus estimate is a forecast of a public company’s projected earnings, the results of a particular industry, sector, geography, asset class, or other category, or the expected findings of a macroeconomic report based on the combined estimates of analysts and other market observers that track the stock or data in question.
Core PCE, officially known as the Personal Consumption Expenditures (PCE) excluding Food and Energy, Price Index, is a measure of the prices that U.S. consumers pay for goods and services, not including two categories — food and energy — where prices tend to swing up and down more dramatically and more often than other prices. The core PCE price index, released monthly by the U.S. Department of Commerce Bureau of Economic Analysis, measures inflation trends and is watched closely by the U.S. Federal Reserve as it conducts monetary policy.
Correlation is a statistic that measures the degree to which two securities move in relation to each other.
Cyclical stocks have prices influenced by macroeconomic changes in the economy and are known for following the economy as it cycles through expansion, peak, recession, and recovery.
Defensive stocks provide consistent dividends and stable earnings regardless of whether the overall stock market is rising or falling. Companies with shares considered to be defensive tend to have a constant demand for their products or services and thus their operations are more stable during different phases of the business cycle.
The dual mandate consists of two over-arching goals that influence the course of monetary policy set by the U.S. Federal Reserve. Those goals are maximum employment and stable prices. Maximum employment is defined as the highest level of employment or lowest level of unemployment that the economy can sustain while maintaining a stable inflation rate.
Earnings per share (EPS) is calculated as a company’s profit divided by the outstanding shares of its common stock. The resulting number serves as an indicator of a company’s profitability.
The federal funds rate is the target interest rate set by the Federal Open Market Committee of the U.S. Federal Reserve. The target is the Fed’s suggested rate for commercial banks to borrow and lend their excess reserves to each other overnight.
The Federal Open Market Committee (FOMC) consists of 12 members: the seven members of the Board of Governors of the Federal Reserve System; the president of the Federal Reserve Bank of New York; and four of the remaining 11 Reserve Bank presidents, who serve one-year terms on a rotating basis. The FOMC holds eight regularly scheduled meetings per year at which it reviews economic and financial conditions, determines the appropriate stance of monetary policy, and assesses the risks to its long-run goals of price stability and sustainable economic growth.
The Federal Reserve’s inflation target rate is the rate of price increases that the Fed prefers to see to ensure the economy will remain stable. Generally, the Fed’s target rate is 2%, as measured by the Personal Consumption Expenditures (PCE) Price Index.
Gross domestic product (GDP) is the total value of goods and services provided in an economy during a specified period, often one year.
Guidance refers statements from the managers of publicly traded companies that indicate whether they expect to realize near-term profits or losses and why.
A hedge is an investment or investment strategy that is designed to lessen the potential for losses in other investments. The price of an investment considered to be a hedge often moves in the opposite direction of the prices of the investments being hedged.
Hyperscaler refers to the largest cloud computing providers that can provide massive amounts of computing resources and storage at enterprise scale.
The Institute for Supply Management (ISM) Purchasing Managers’ Index (PMI) measures the prevailing direction of economic trends in the manufacturing sector. It consists of an index summarizing whether market conditions as reported in a monthly survey of supply chain managers are expanding, staying the same, or contracting.
The Job Openings and Labor Turnover Survey (JOLTS) program produces monthly data on job openings, hires, and separations compiled by the U.S. Bureau of Labor Statistics. The survey’s job openings rates consider month-to-month changes in the number of job openings reported on both a state and national level.
The Magnificent Seven refers to the seven largest stocks by market capitalization in the S&P 500 Index, as of Dec. 29, 2023. Collectively they made up more than 25% of the market capitalization of the entire index. They are Alphabet, Amazon.com, Apple, Meta Platforms, Microsoft, NVIDIA and Tesla.
Market capitalization, or market cap, refers to the total dollar market value of a company’s outstanding shares of stock.
The payroll report, officially known as the Employment Situation Summary, is a monthly U.S. Bureau of Labor Statistics (BLS) report tracking nonfarm payroll employment and the national unemployment rate, with data on changes in average hourly earnings, and job trends in public and private sectors of employment. The report is based on surveys of households and employers.
Seasonality refers to predictable changes that occur over a one-year period in a business, market, market sector, or economy based on the season, including calendar or commercial seasons.
A soft landing occurs when a central bank successfully adjusts interest rates to reduce inflation and slow economic growth while avoiding a recession.
The S&P Global Flash U.S. Composite PMI® is produced by S&P Global and is based on original survey data collected from a representative panel of around 800 companies based in the U.S. manufacturing and service sectors. The flash estimate is based on around 85% of total PMI survey responses each month and is designed to provide an accurate advance indication of the final PMI data.
Tailwind is a term used to describe events or market forces that exert a positive influence on an investment’s performance.
Trailing indicators are data or measurements that reflect events, trends, results, or developments that took place in the past. Trailing indicators typically refer to a specific time period for which the data in question is aggregated, summed, or averaged. Trailing indicators help reflect trends that occur over specified periods of time.
Underweight describes a portfolio position in an industry sector or some other category that is less than the corresponding weight level in a benchmark portfolio.
Unwinding describes the process of closing out what is often a large or complicated trading position.
A zero interest rate policy (ZIRP) is when a central bank sets its target short-term interest rate at or close to 0%, typically to expand credit and stimulate economic activity.
Indices
The S&P 500 Index measures change in stock market conditions based on the average performance of 500 widely held common stocks. It is a market-weighted index calculated on a total return basis with dividend reinvested. The S&P 500 represents approximately 80% of the investable U.S. equity market.
The S&P 500® Equal Weight Index is the equal-weight version of the S&P 500. It includes the same constituents as the capitalization-weighted S&P 500, but each company in the S&P 500 Equal Weight Index is allocated a fixed weight, or 0.2% of the index total at each quarterly rebalance.
The Nasdaq Composite Index is the market capitalization-weighted index of over 2,500 common equities listed on the Nasdaq stock exchange.
The NIFTY 50 Index is a stock index on the National Stock Exchange of India that tracks the largest assets in the Indian equity market. It is diversified across 13 sectors of the Indian economy: financial services, information technology, consumer goods, oil and gas, automobiles, telecommunications, construction, pharmaceuticals, metals, power, cement and cement products, fertilizers and pesticides, and media and entertainment.
The Russell 2000® Index measures the performance of the 2,000 smallest companies in the Russell 3000® Index, which represents approximately 7% of the total market capitalization of the Russell 3000® Index.
London Stock Exchange Group plc and its group undertakings (collectively, the “LSE Group”). ©LSE Group 2024. FTSE Russell is a trading name of certain of the LSE Group companies. Russell® is a trademark of the relevant LSE Group companies and is used by any other LSE Group company under license. All rights in the FTSE Russell indexes or data vest in the relevant LSE Group company which owns the index or the data. Neither LSE Group nor its licensors accept any liability for any errors or omissions in the indexes or data and no party may rely on any indexes or data contained in this communication. No further distribution of data from the LSE Group is permitted without the relevant LSE Group company’s express written consent. The LSE Group does not promote, sponsor, or endorse the content of this communication.
M-633288 Exp. 2/28/2025
