“
”Markets in Focus
Timely analysis of market moves and sectors of opportunity
The past quarter demonstrated the merits of staying invested and ignoring market noise.
Markets seem to have recalibrated to accommodate fickle policy decisions: The Chicago Board Options Exchange (CBOE) Volatility Index (VIX) is at a four-month low.
Joey Del Guercio, CFA, sees potential opportunities in mid-cap stocks, international equities, and defense companies, especially following NATO’s increased spending commitments.
The S&P 500 Index recovered from a -19% intra-year drawdown and ended Friday with its first all-time high since February 19, just 128 days ago. And it wasn’t alone: the Nasdaq 100®, MSCI ACWI® (All Country World Index), and MSCI EAFE (Europe, Australasia, and the Far East) Net Index all closed last week at record highs.1
Joey Del Guercio, CFA, Market Strategy Research Associate at Raymond James Investment Management, said that although a lot of market-defining news will come in the near-to-mid term, the past quarter demonstrates the merits of staying invested and fading the noise — the S&P 500 Index is up +5.6% year to date, annualizing a double-digit return despite all of the macro-induced volatility.
“Consolidation would certainly be welcome, considering the steepness of this rally,” Del Guercio said, “But I maintain my view that for equities, the path of least resistance remains higher.”
In the awkward purgatory between earnings seasons, markets have chiefly been driven by macroeconomic news, and last week was broadly positive. Tensions in the Middle East eased after Iran’s underwhelming retaliation against the U.S. was followed by Israel and Iran agreeing to a ceasefire. Oil fell precipitously.
On the trade front, U.S. President Donald Trump announced that a deal had been signed with China and agreements with other countries were nearing completion, although currently only the U.K. trade deal is in effect. U.S. Treasury Secretary Scott Bessent downplayed the urgency of getting deals done before the July 9 deadline and floated Labor Day as a new soft deadline, which Del Guercio said was debatably positive for markets.
Seasonality is on our side
S&P 500 Index average monthly returns
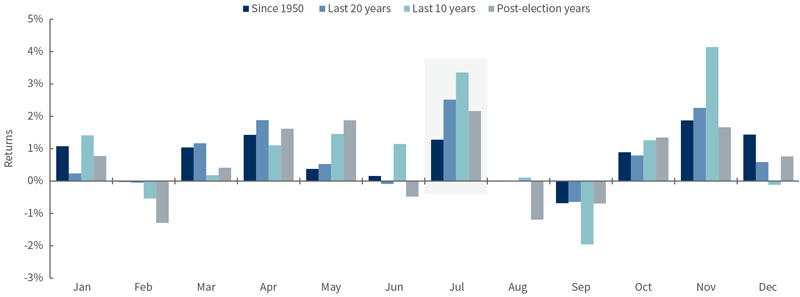
Source: Bloomberg, as of 6/27/25.
“While last week was certainly a net positive on the trade front, Trump did halt talks with Canada and threatened additional tariffs,” Del Guercio said. As of Monday morning, Canada had made concessions in an effort to restart negotiations.
“This is just a reminder that while policy decisions remain fickle, the market has adjusted. In my view, it’s increasingly clear that the market is calibrated to the macro mayhem we’ve all had to stomach this year — the VIX currently stands at a four-month low,” he said.
The June meeting of the Federal Open Market Committee (FOMC) also brought a positive update on the state of the economy. There were no fireworks, with the focus again on why the U.S. Federal Reserve (Fed) is reluctant to cut interest rates. Orton said it’s “unusually unclear what would trigger a rate cut,” particularly on the inflation side, which he said is likely why there wasn’t too much of a market reaction. On the positive side, the meeting statement and Fed Chair Jerome Powell’s press conference projected continued confidence in the U.S. economic expansion. Powell stated that the Fed was “well positioned to wait to learn more” and that “we’re going to learn a great deal more over the summer,” suggesting that the FOMC is likely to stay on hold at least until September. That said, it’s worth noting the increasing differences of opinion reflected in the FOMC’s summary of economic projections (SEP). There seems to be one camp that favors some rate cuts later this year and another that prefers none. While the median “dot” in the FOMC’s dot plot reflects the former, Powell argued forcefully for the latter at the press conference. Orton said Powell’s view will likely win at the end of the day, but it does signal that the path of data over the summer will be critically important. That, in turn, means that any Middle East developments that affect oil prices are likely to shape the outlook for inflation. Additionally, Powell mentioned that he expects prices for goods (and presumably overall inflation) to pick up again in coming months. What happens with respect to the administration’s tariff policy after July 9, when its pause on moving ahead with higher tariffs on a wide range of countries expires, will be important.
“Markets have been riddled with pessimism,” Del Guercio said. “From tariffs to geopolitics to the recession that never came, there have been myriad excuses to avoid investing in this market.”
But Del Guercio sees reasons for optimism, including:
Historically, July has been one of the best months for equities.
Declining volatility could allow commodity trading advisors (CTAs) and trend-following strategies to increase their equity exposure.
The United States has made progress on its trade policy
The worst of the Middle East flare-ups are likely in the rear-view mirror.
“Finally, I think it’s important to remind investors that all-time highs have historically led to more all-time highs,” Del Guercio said.
“If it wasn’t obvious, I’m bullish on equities,” Del Guercio said. In his view, the major risks are connected with expectations for the U.S. Federal Reserve’s (Fed’s) interest rate cuts and the reactions to rumors about announcing a replacement for the current Fed chair, which could occur as early as September. “I worry about the market follow through we could see on the date of the official announcement,” he said.
Del Guercio suggests that investors consider being well diversified across geographies, sectors, and industries, leaning into quality across the board. He favors cyclicality and leaning into long-term megatrends like artificial intelligence and defense spending. Other areas of opportunity that he is considering include:
Mid-cap companies. Mid caps can offer quality, compounding investments for selective active managers who are looking for long-term diversification at the lower end of the capitalization range. These companies tend to be much less economically sensitive than small caps, with favorable long-term risk-adjusted returns.
Playing offense with defense companies. Last week’s NATO Summit bolstered the case for defense companies as a long-term, durable investment theme. All NATO members are currently expected to spend 2.5% of their gross domestic product (GDP) on defense spending in 2025, and the group agreed that each member will spend 5% of its GDP on defense spending by 2035. Del Guercio noted that although many international defense names have already doubled or tripled in value year-to-date, investors might consider adding exposure on pullbacks. (In his recent appearance on CNBC’s Power Lunch, Chief Market Strategist Matt Orton, CFA, elaborated on this theme.)
International equities. The U.S. has experienced an exceptional rally, but international equities, as represented by the MSCI ACWI (All Country World Index) ex USA Index, have enjoyed their best first half of a year relative to the S&P 500 Index since 1993.
“International equities can continue to rise without it being at the expense of the S&P 500 Index,” Del Guercio said. “With U.S. investors broadly lacking overseas exposure, it’s reasonable to ask ‘why don’t I own more international?’”
The Services ISM® Report on Business® and Job Openings and Labor Turnover Survey (JOLTS) will be issued on Tuesday. The ADP® National Employment Report™ comes out on Wednesday. The non-manufacturing Purchasing Managers’ Index (PMI) will be released on Thursday, and the U.S. Bureau of Labor Statistics will publish the Employment Situation Summary, which includes updated nonfarm payrolls and unemployment data.
1 Unless otherwise indicated, all data cited is sourced from Bloomberg as of June 27, 2025.
Risk Information:
Investing involves risk, including risk of loss.
Diversification does not ensure a profit or guarantee against loss.
Disclosures:
Link(s) are being provided for informational purposes only. Raymond James Investment Management is not affiliated with and does not endorse, authorize or sponsor any of the listed websites or their respective sponsors. Raymond James Investment Management is not responsible for the content of any website or the collection or use of information regarding any website’s users and/or members
Index or benchmark performance presented in this document does not reflect the deduction of advisory fees, transaction charges, or other expenses, which would reduce performance. Indexes are unmanaged. It is not possible to invest directly in an index. Any investor who attempts to mimic the performance of an index would incur fees and expenses that would reduce return.
This document is a general communication being provided for informational purposes only. It is educational in nature and not designed to be taken as advice or a recommendation for any specific investment product, strategy, plan feature, or other purpose in any jurisdiction, nor is it a commitment from Raymond James Investment Management or any of its affiliates to participate in any of the transactions mentioned herein. Any examples used are generic, hypothetical, and for illustration purposes only. This material does not contain sufficient information to support an investment decision, and you should not rely on it in evaluating the merits of investing in any securities or products. In addition, users should make an independent assessment of the legal, regulatory, tax, credit, and accounting implications and make their own determinations together with their own professionals in those fields. Any forecasts, figures, opinions, or investment techniques and strategies set out are for information purposes only, based on certain assumptions and current market conditions, and are subject to change without prior notice. All information presented herein is considered to be accurate at the time of production, but no warranty of accuracy is given and no liability in respect of any error or omission is accepted. It should be noted that investment involves risks, the value of investments and the income from them may fluctuate in accordance with market conditions and taxation agreements, and investors may not get back the full amount invested. Both past performance and yields are not reliable indicators of current and future results.
The views and opinions expressed are not necessarily those of the broker/dealer or any affiliates. Nothing discussed or suggested should be construed as permission to supersede or circumvent any broker/dealer policies, procedures, rules, and guidelines.
Sector investments are companies engaged in business related to a specific sector. They are subject to fierce competition and their products and services may be subject to rapid obsolescence. There are additional risks associated with investing in an individual sector, including limited diversification.
Investing in small cap stocks generally involves greater risks, and therefore, may not be appropriate for every investor. The prices of small company stocks may be subject to more volatility than those of large company stocks.
International investing presents specific risks, such as currency fluctuations, differences in financial accounting standards, and potential political and economic instability. These risks are further accentuated in emerging market countries where risks can also include possible economic dependency on revenues from particular commodities or on international aid or development assistance, currency transfer restrictions, and liquidity risks related to lower trading volumes.
Investing in bonds involves risks that may adversely affect the value of your investment such as inflation risk, credit risk, call risk, interest rate risk, and liquidity risk, among others. The two most prominent factors are interest rate movements and the credit worthiness of the bond issuer. Investors should pay careful attention to the types of fixed income securities that comprise their portfolios and remember that, as with all investments, there is the risk of loss of capital.
Definitions
Artificial intelligence (AI) is technology that enables computers and machines to simulate human learning, comprehension, problem solving, decision making, creativity and autonomy.
The ADP® National Employment Report™ is published monthly by the ADP Research Institute® in close collaboration with Moody’s Analytics. The ADP® National Employment Report™ provides a monthly snapshot of U.S. nonfarm private sector Employment based on actual transactional data.
A commodity trading advisor (CTA) is an investment professional or firm that provides client-specific advice on buying and selling futures contracts.
Compounding is the reinvestment of an asset’s earnings, either from capital gains or from interest, to generate additional earnings over time. This growth is calculated using exponential functions and takes place because the reinvestment generates earnings from both the principal initially invested and the accumulated earnings from periods after that initial investment.
Consolidation is a term used in technical analysis to describe when stocks reverse previous gains (or losses) to stay within well-defined trading levels.
Cyclicality is an investment strategy that attempts to follow the economy as it cycles through expansion, peak, recession, and recovery states.
A drawdown is a decline in the returns of a security or group of securities, as measured over a period from the peak of returns to their trough.
The payroll report, officially known as the Employment Situation Summary, is a monthly U.S. Bureau of Labor Statistics (BLS) report tracking nonfarm payroll employment and the national unemployment rate, with data on changes in average hourly earnings, and job trends in public and private sectors of employment. The report is based on surveys of households and employers.
Fade describes an investment strategy of ignoring or trading against a prevailing trend in the market.
Gross domestic product (GDP) is the total value of goods and services provided in an economy during a specified period, often one quarter or one year. As new data comes in, the U.S. Bureau of Economic Analysis periodically publishes revisions to previous estimates of GDP, its components and measures related to estimated GDP.
The quits rate, as reported by the U.S. Bureau of Labor Statistics Job Openings and Labor Turnover Survey (JOLTS), is the number of quits, or individuals who have left jobs, during the entire month as a percent of employment.
Market capitalization, or market cap, refers to the total dollar market value of a company’s outstanding shares of stock.
Macroeconomic refers to the branch of economics that focuses on seeking to understand the interactions between the markets, businesses, governments, and consumers that make up an entire economy.
A megatrend is a widespread and long-term macroeconomic, technological, social, environmental, political, or other change that may develop slowly at first but that has a major, ongoing impact once it gets underway. Megatrends are distinct from smaller trends in business, economic, or other spheres of activity that have less far-reaching or enduring effects.
NATO, or the North Atlantic Treaty Organization, is a political and military alliance of 32 countries from Europe and North America that is organized to guarantee their security and cooperation.
The non-manufacturing Purchasing Managers’ Index (PMI), also known as the ISM Services PMI, measures the prevailing direction of economic trends in the non-manufacturing sector. It is created by the Institute for Supply Management (ISM).
Quality investing is a strategy that seeks to invest in companies with low debt, stable earnings, consistent asset growth, and strong corporate governance, as reflected in financial metrics such as ratios of return to equity and debt to equity, as well as to earnings variability.
The Services ISM® Report on Business® is produced by the Institute for Supply Management (ISM) and is based on data compiled from purchasing and supply executives in a wide variety of industries nationwide. Survey responses reflect the change, if any, in the current month compared to the previous month in supplier deliveries along with seasonally adjusted business activity, new orders, and employment.
Indices
The S&P 500 Index measures changes in stock market conditions based on the average performance of 500 widely held common stocks. It is a market-weighted index calculated on a total return basis with dividend reinvested. The S&P 500 represents approximately 80% of the investable U.S. equity market.
The Chicago Board Options Exchange (CBOE) Volatility Index (VIX) , is a real-time market index that represents the market’s expectation of 30-day forward-looking volatility. Derived from the price inputs of the S&P 500 index options, it provides a measure of market risk and investors’ sentiments.
The Nasdaq 100® is a stock market index made up of 103 equity securities issued by 100 of the largest non-financial companies listed on the Nasdaq stock market. It is a modified capitalization-weighted index.
The MSCI ACWI (All Country World Index) ex USA Index captures large- and mid-cap representation across 22 of 23 developed markets countries (excluding the United States) and 24 emerging markets countries. With 2,056 constituents, the index covers approximately 85% of the global equity opportunity set outside the United States. Developed markets countries include Australia, Austria, Belgium, Canada, Denmark, Finland, France, Germany, Hong Kong, Ireland, Israel, Italy, Japan, Netherlands, New Zealand, Norway, Portugal, Singapore, Spain, Sweden, Switzerland and the U.K. Emerging markets countries include Brazil, Chile, China, Colombia, Czech Republic, Egypt, Greece, Hungary, India, Indonesia, Korea, Kuwait, Malaysia, Mexico, Peru, Philippines, Poland, Qatar, Saudi Arabia, South Africa, Taiwan, Thailand, Turkey and United Arab Emirates.
The MSCI EAFE (Europe, Australasia, and the Far East) Net Index measures the performance of performance of large and mid-cap securities across 21 developed markets, including countries in Europe, Australasia and the Far East, excluding the United States and Canada. The MSCI EAFE Net Index subtracts any foreign taxes applicable to U.S. citizens but not applicable to citizens in the overseas country.
The MSCI ACWI® (All Country World Index) measures the performance of large and mid-cap stocks across 23 developed markets (DM) and 24 emerging markets (EM) countries.
M-763279 Exp. 10/30/2025
The key to the market now is whether and how much Iran’s next actions disrupt oil prices going forward.
Despite the geopolitical uncertainty, healthy fundamentals continue to support the U.S. equity market.
Matt Orton, CFA, sees potential opportunities in long-term durable secular growth themes such as artificial intelligence and its spinoffs, the growth of global defense spending, and select international markets.
As one waiting game ends, another begins, leaving investors to continue navigating through a macroeconomic fog.
“Iran’s response to the targeted U.S. strikes over the weekend will determine the market reaction,” said Matt Orton, CFA, Chief Market Strategist at Raymond James Investment Management. “Frankly, the market ultimately only cares whether oil prices will be sustainably disrupted. It’s too early to know how much the risk of disruption has risen, and that uncertainty will likely provide support for haven assets and caution in the near term.”
Orton said it will be particularly important to follow the reaction of the dollar, which has finally found some support amid increasing tensions in the Middle East.1 A further bounce risks triggering a short squeeze for many investors. That could, in turn, weigh on international equities and keep volatility elevated as we head into the busy second-quarter earnings period.
“Despite all of this uncertainty, I believe investors should not lose focus on the positive fundamentals that exist on both the company and macroeconomic levels,” Orton said. “This market has managed to scale an ever-growing wall of worry. I expect that to remain the case.”
That’s largely because corporate fundamentals remain strong, particularly across large-cap information technology, financials, and industrials. Orton said he wouldn’t chase the market higher given some strong technical resistance coupled with elevated macroeconomic uncertainty, but he would be ready to use downside opportunistically. Specifically, he believes investors should consider leaning into diversification across asset classes, geographies, and sectors or industries in an effort to build better balance in their portfolios. There are several notable long-term durable secular growth themes across the market that remain attractive and could help to offset the headline uncertainty now, he said. While the U.S. strikes escalate the conflict and increase the risks of more extreme scenarios, Orton said he believes these probabilities to be low.
The biggest risk – and the main focus of the market – is the possibility of disruption of tanker traffic in the Strait of Hormuz, through which nearly 30% of seaborne crude oil flows. Any disruption could push oil prices well above $100 per barrel, he said. He expects this risk to push crude oil prices higher this week, but he said they still remain far from levels that would be problematic to global growth.
Additionally, during periods of sustained disruption, OPEC+ – the Organization of the Petroleum Exporting Countries, plus 10 other oil-producing countries, including Russia – has historically increased production to try and keep production in balance. Meanwhile, the United States has become a net oil exporter. This leaves Europe potentially the most exposed to a shock in energy prices. Absent an extreme event, Orton doesn’t expect the increase in oil prices to affect inflation meaningfully in coming months. Meanwhile, looser financial conditions, improving consumer sentiment, and another month of solid labor market data could give investors greater confidence in the economic outlook, even amid the uncertainty in the Middle East.
The June meeting of the Federal Open Market Committee (FOMC) also brought a positive update on the state of the economy. There were no fireworks, with the focus again on why the U.S. Federal Reserve (Fed) is reluctant to cut interest rates. Orton said it’s “unusually unclear what would trigger a rate cut,” particularly on the inflation side, which he said is likely why there wasn’t too much of a market reaction. On the positive side, the meeting statement and Fed Chair Jerome Powell’s press conference projected continued confidence in the U.S. economic expansion. Powell stated that the Fed was “well positioned to wait to learn more” and that “we’re going to learn a great deal more over the summer,” suggesting that the FOMC is likely to stay on hold at least until September. That said, it’s worth noting the increasing differences of opinion reflected in the FOMC’s summary of economic projections (SEP). There seems to be one camp that favors some rate cuts later this year and another that prefers none. While the median “dot” in the FOMC’s dot plot reflects the former, Powell argued forcefully for the latter at the press conference. Orton said Powell’s view will likely win at the end of the day, but it does signal that the path of data over the summer will be critically important. That, in turn, means that any Middle East developments that affect oil prices are likely to shape the outlook for inflation. Additionally, Powell mentioned that he expects prices for goods (and presumably overall inflation) to pick up again in coming months. What happens with respect to the administration’s tariff policy after July 9, when its pause on moving ahead with higher tariffs on a wide range of countries expires, will be important.
“There are just so many unknowns with respect to inflation that, absent a significant weakening in the labor market, it’s very unlikely that the Fed does anything,” Orton said. “I continue to believe we’ll see one cut this year.”
Most S&P 500 sectors are beating the index year to date
2025 year-to-date S&P 500 sector returns through 6/20/2025
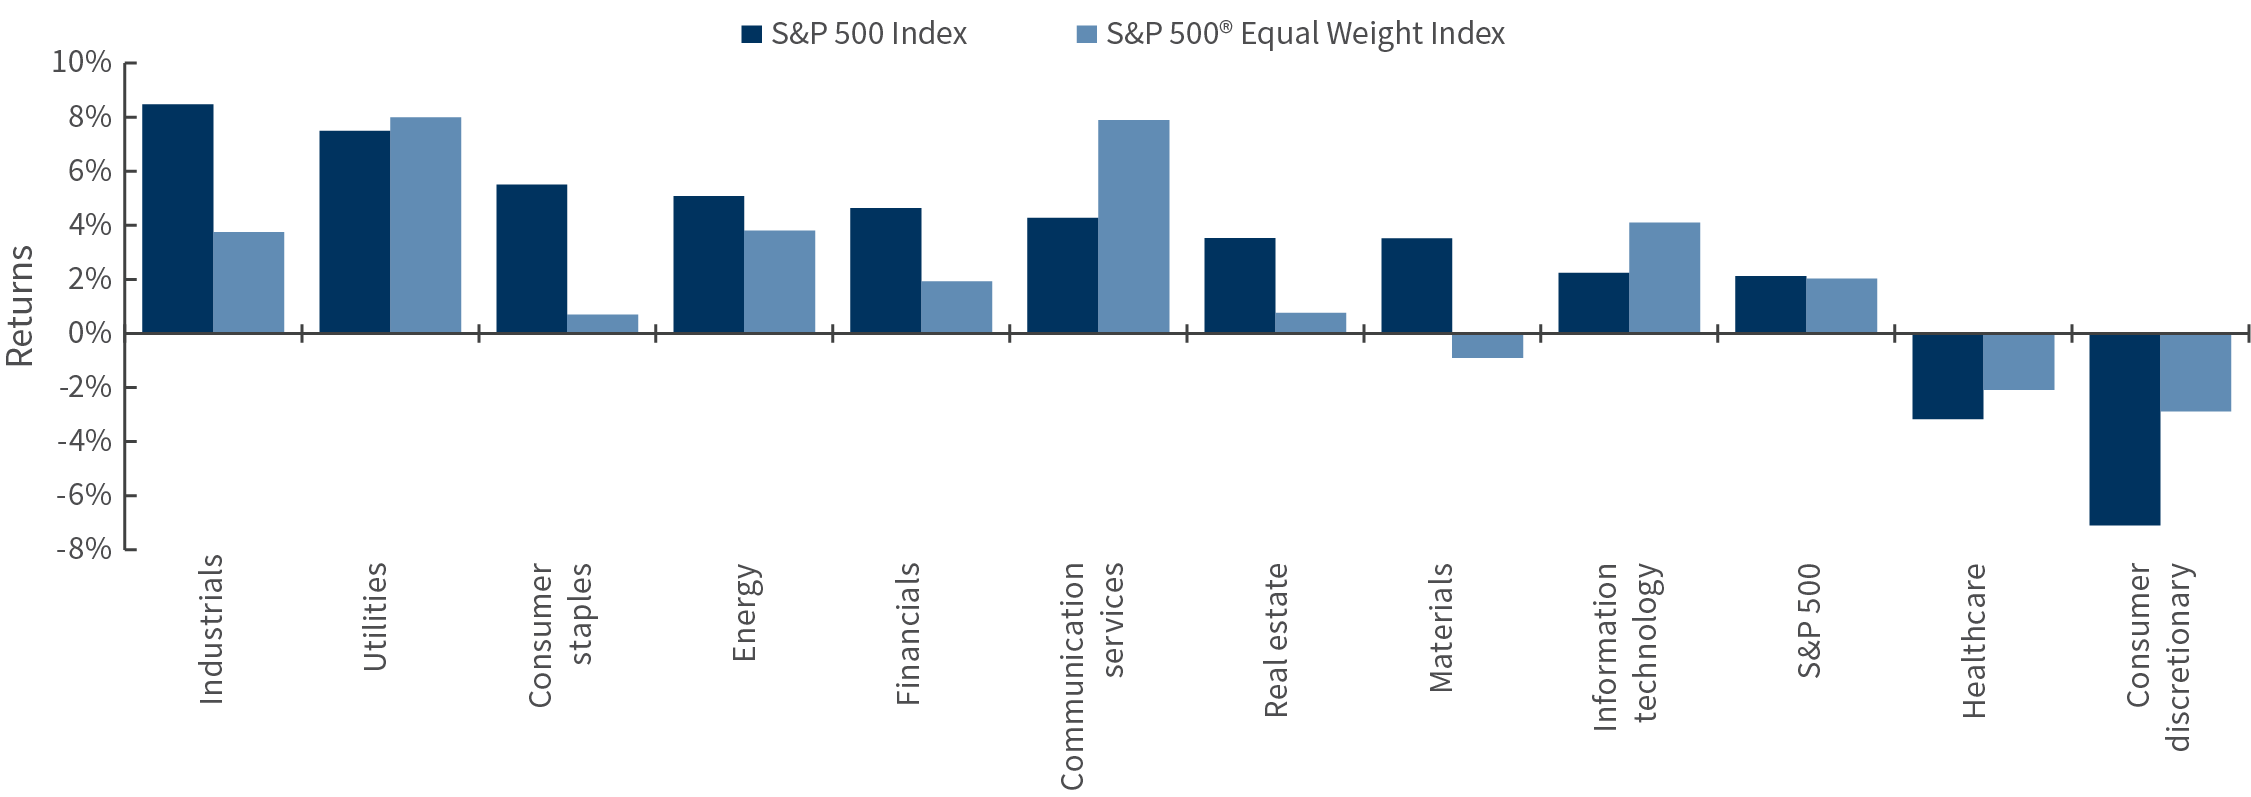
Source: Bloomberg, as of 6/20/25.
Geopolitics is in the driver’s seat now, but other important catalysts are coming soon. First, there’s the potential volatility around the Republican tax and policy bill in the Senate as well as the impending July 9 deadline on the pause of reciprocal tariffs.
While the market has held up well – the S&P 500 Index is only off 3% from its all-time high in February and has traded within a 2% band so far in June – uncertainty is reflected beneath the surface. The S&P 500® Equal Weight Index has underperformed during the rebound that began on April 8 while the percentage of stocks above their 200-day moving average has flatlined.
“I don’t believe this is a harbinger of downside,” Orton said. “Rather, I see it as a signal that there are very real risks in the near future that are keeping a lid on the extent to which the market can rally until we see some progress made.”
Additionally, he noted that these risks impact the average stock more than some of the mega-caps that are positioned to benefit from durable growth themes.
“I have been expecting dispersion to rise as the easy money has already been made on the recovery rally, which means that selectivity matters more,” Orton said. Geopolitical risk is a key reason why he doesn’t advocate for investors to chase the rally. At the same time, nor does he advocate for reducing risk. Rather, he sees a potential opportunity to use downside opportunistically to increase market exposure and to consider leaning into some key long-term durable secular growth trends manifesting themselves across market capitalizations and sectors or industries. Those include:
Artificial intelligence (AI) and its derivatives. Artificial Intelligence is one of the most durable secular growth themes, Orton said, and he continues to like “AI 2.0” – the companies tangential to the hyperscalers and infrastructure layer that stand to benefit the most from the expected $335 billion in capital expenditures this year. There is a narrative that the mega-caps are all crowded and priced for perfection, but there has been meaningful dispersion in performance, with select high-quality stocks trading at price-to-earnings ratios below that of the S&P 500 as a whole. This is one of the largest valuation divergences in the past decade. Also, resilience among AI-related power-generation companies has been overshadowed by geopolitical and tariff concerns.
Playing offense with defense. Not surprisingly, defense companies have been among the strongest performers across global markets given continued escalation in the Middle East and growing concerns around Russia and China. Defense spending was front and center at the Paris Air Show last week and it will continue to be in the spotlight with the NATO Summit taking place this week at the Hague. Orton expects to see an announcement of spending by NATO members of 5% of gross domestic product (GDP), with 3.5% on defense and 1.5% on defense-related infrastructure. The NATO capability review also could provide potential investment catalysts as more specifics around fiscal investments are outlined. Overall, while haven assets can help to hedge geopolitical conflict, Orton said defense offers the potential not only to hedge but to play offense as global conflict boosts defense stock performance.
Global diversification. Progress on trade seems to have taken a back seat to the Iran nuclear crisis, but the clock has not stopped ticking on the Trump administration’s July 9 deadline to strike new trade deals. Some markets have underperformed the United States recently, particularly Europe, given its leverage to oil and gas prices as well as its needs for both individual nations’ agreements on trade with the U.S. and for a deal between the U.S. and China. That said, there are markets where meaningful improvements are taking place like the UK as well as reasons to be more optimistic about regions like Europe. Countries like Germany are more likely to deliver increased fiscal spending, especially with respect to defense, and Orton is optimistic about the potential for more fiscal integration across the European Union. In Japan, Orton believes banks look poised to perform well given that the interest-rate hiking cycle is expected to continue. Emerging markets also look attractive, especially in markets like India, which has structural growth drivers and a market that is more insulated from geopolitical risks.
The week starts with S&P Global Flash Purchasing Managers’ Index™ reports from Japan, the euro area, the U.K., and the United States. Wednesday brings Australia’s Consumer Price Index. Thursday’s releases include reports on U.S. GDP revisions, durable goods, and jobless claims, before Friday closes with CPI readings from Japan, France and Spain. We’ll also get Canada GDP, and the all-important U.S. Personal Consumption Expenditures (PCE) Price Index. The Fed also releases its annual bank stress-test results to end the week.
There is also a packed calendar of Fed officials speaking in a variety of settings following last week’s FOMC meeting. Speakers include:
Monday – Fed Vice Chair Michelle Bowman, Governors Christopher Waller and Adriana Kugler, and Federal Reserve Bank Presidents Austan Goolsbee (Chicago) and John Williams (New York).
Tuesday – Federal Reserve Bank of Cleveland President Beth Hammack speaks on monetary policy, Chair Jerome Powell will deliver his semiannual policy testimony to Congress, and Federal Reserve Bank of Boston President Susan Collins speaks on the state of the nation’s housing.
Thursday – Powell continues his congressional testimony while Federal Reserve Bank of Richmond President Tom Barkin speaks on the economy.
1 Unless otherwise indicated, all data cited is sourced from Bloomberg as of June 20, 2025.
Risk Information:
Investing involves risk, including risk of loss.
Diversification does not ensure a profit or guarantee against loss.
Disclosures:
Link(s) are being provided for informational purposes only. Raymond James Investment Management is not affiliated with and does not endorse, authorize or sponsor any of the listed websites or their respective sponsors. Raymond James Investment Management is not responsible for the content of any website or the collection or use of information regarding any website’s users and/or members
Index or benchmark performance presented in this document does not reflect the deduction of advisory fees, transaction charges, or other expenses, which would reduce performance. Indexes are unmanaged. It is not possible to invest directly in an index. Any investor who attempts to mimic the performance of an index would incur fees and expenses that would reduce return.
This document is a general communication being provided for informational purposes only. It is educational in nature and not designed to be taken as advice or a recommendation for any specific investment product, strategy, plan feature, or other purpose in any jurisdiction, nor is it a commitment from Raymond James Investment Management or any of its affiliates to participate in any of the transactions mentioned herein. Any examples used are generic, hypothetical, and for illustration purposes only. This material does not contain sufficient information to support an investment decision, and you should not rely on it in evaluating the merits of investing in any securities or products. In addition, users should make an independent assessment of the legal, regulatory, tax, credit, and accounting implications and make their own determinations together with their own professionals in those fields. Any forecasts, figures, opinions, or investment techniques and strategies set out are for information purposes only, based on certain assumptions and current market conditions, and are subject to change without prior notice. All information presented herein is considered to be accurate at the time of production, but no warranty of accuracy is given and no liability in respect of any error or omission is accepted. It should be noted that investment involves risks, the value of investments and the income from them may fluctuate in accordance with market conditions and taxation agreements, and investors may not get back the full amount invested. Both past performance and yields are not reliable indicators of current and future results.
The views and opinions expressed are not necessarily those of the broker/dealer or any affiliates. Nothing discussed or suggested should be construed as permission to supersede or circumvent any broker/dealer policies, procedures, rules, and guidelines.
Sector investments are companies engaged in business related to a specific sector. They are subject to fierce competition and their products and services may be subject to rapid obsolescence. There are additional risks associated with investing in an individual sector, including limited diversification.
Investing in small cap stocks generally involves greater risks, and therefore, may not be appropriate for every investor. The prices of small company stocks may be subject to more volatility than those of large company stocks.
International investing presents specific risks, such as currency fluctuations, differences in financial accounting standards, and potential political and economic instability. These risks are further accentuated in emerging market countries where risks can also include possible economic dependency on revenues from particular commodities or on international aid or development assistance, currency transfer restrictions, and liquidity risks related to lower trading volumes.
Investing in bonds involves risks that may adversely affect the value of your investment such as inflation risk, credit risk, call risk, interest rate risk, and liquidity risk, among others. The two most prominent factors are interest rate movements and the credit worthiness of the bond issuer. Investors should pay careful attention to the types of fixed income securities that comprise their portfolios and remember that, as with all investments, there is the risk of loss of capital.
Definitions
Artificial intelligence (AI) is technology that enables computers and machines to simulate human learning, comprehension, problem solving, decision making, creativity and autonomy.
The Australian Consumer Price Index is a quarterly report from the Australian Bureau of Statistics measuring household inflation. It includes statistics about changes in price for a wide range of categories of household spending.
Bank stress tests, conducted annually by the U.S. Federal Reserve Board, are a tool to help ensure that large banks can support the economy during downturns. The test evaluates the resilience of large banks by estimating their capital levels, losses, revenue and expenses under a single hypothetical recession and financial market shock, using banks’ data as of the end of last year. The individual results from the stress test inform a bank’s capital requirements to help ensure that a bank could survive a severe recession and financial market shock.
Capital expenditures, or capex, are monies used by a company to buy, improve, or maintain physical assets such as real estate, facilities, technology, or equipment, and may include new projects or investments.
The daily moving average (DMA) is a calculation that takes the arithmetic mean of a given set of prices over the specific number of days in the past; for example, over the previous 15, 30, 100, or 200 days.
Dispersion refers to the range of outcomes in different areas of a financial market or to the potential outcomes of investments based on historical volatility or returns.
The dot plot is a U.S. Federal Reserve chart summarizing the Federal Open Market Committee’s (FOMC) outlook for the federal funds rate. Each dot represents the interest rate forecasted by one of the 12 members of the committee.
The U.S. Durable Goods Orders report is compiled from the U.S. Census Bureau’s Manufacturers’ Shipments, Inventories, and Orders (M3) survey, which is a voluntary survey that provides statistics on a calendar-month basis for manufacturers’ value of shipments, new orders (net of cancellations), end-of-month order backlog (unfilled orders), end-of-month total inventory (at current cost or market value), and inventories by stage of fabrication (materials and supplies, work-in-process, and finished goods).
Earnings per share (EPS) is calculated as a company’s profit divided by the outstanding shares of its common stock. The resulting number serves as an indicator of a company’s profitability.
The Federal Open Market Committee (FOMC) consists of 12 members: the seven members of the Board of Governors of the Federal Reserve System; the president of the Federal Reserve Bank of New York; and four of the remaining 11 Reserve Bank presidents, who serve one-year terms on a rotating basis. The FOMC holds eight regularly scheduled meetings per year at which it reviews economic and financial conditions, determines the appropriate stance of monetary policy, and assesses the risks to its long-run goals of price stability and sustainable economic growth. The FOMC observes a blackout period, which begins at midnight of the second Saturday before each meeting. During the blackout periods, committee members do not make public comments about macroeconomic developments or monetary policy issues.
Fiscal policy refers to the tax collection and spending a government uses to influence its country’s economy.
The France Consumer Price Index (CPI), published by the National Institute of Statistics and Economic Studies, is the instrument used to measure inflation. It allows the estimation of the average variation between two given periods in the prices of products consumed by households. It is based on the observation of a fixed basket of goods updated every year. Each product has a weight in the overall index that is proportional to its weight in household expenditure.
Gross domestic product (GDP) is the total value of goods and services provided in an economy during a specified period, often one quarter or one year. As new data comes in, the U.S. Bureau of Economic Analysis periodically publishes revisions to previous estimates of GDP, its components and measures related to estimated GDP.
Haven assets are investments that are expected at least to hold their value and possibly even rise in value during market downturns or economic distress.
A hedge is an investment or investment strategy that is designed to lessen the potential for losses in other investments. The price of an investment considered to be a hedge often moves in the opposite direction of the prices of the investments being hedged.
Hyperscalers refers to the largest cloud computing providers that can provide massive amounts of computing resources and storage at enterprise scale.
The Japan Consumer Price Index (CPI), released monthly by the Statistics Bureau of Japan, tracks core inflation by monitoring price changes in a wide variety of goods and services, excluding fresh foods but including energy, purchased by households nationwide.
Initial jobless claims, reported weekly by the U.S. Department of Labor, track the number seasonally adjusted first-time claims for unemployment insurance filed by unemployed workers.
Loose financial conditions are marked by an increase in available funds or a decline in interest rates that reduces the costs of lending and accordingly drives up demand.
Market capitalization, or market cap, refers to the total dollar market value of a company’s outstanding shares of stock.
Macroeconomic refers to the branch of economics that focuses on seeking to understand the interactions between the markets, businesses, governments, and consumers that make up an entire economy.
Mega-cap stocks are the largest publicly traded companies as measured by market capitalization. Generally, this refers to companies with market capitalizations over $200 billion.
Monetary policy refers to the decisions made by central banks to raise or lower benchmark interest rates or otherwise tighten or loosen credit to influence an economy’s growth, inflation, or employment levels.
NATO, or the North Atlantic Treaty Organization, is a political and military alliance of 32 countries from Europe and North America that is organized to guarantee their security and cooperation.
The One, Big, Beautiful Bill Act refers to a proposed congressional bill that would raise the U.S. debt ceiling by $4 trillion, as well as make permanent tax cuts created by the Tax Cuts and Jobs Act of 2017, change a wide range of other aspects of federal tax policy, eliminate taxes on tips, overtime, car loan interest, make changes to health insurance legislation, phase out or reduce credits for clean energy production or use, and remove tax benefits for illegal immigrants, among other things.
The Organization of the Petroleum Exporting Countries, also known as OPEC, was founded in 1960 and is a permanent organization of 13 oil-exporting developing nations that coordinates the petroleum policies of its member countries, which are Iran, Iraq, Kuwait, Saudi Arabia, Venezuela, Libya, the United Arab Emirates, Algeria, Nigeria, Gabon, Angola, Equatorial Guinea, and Congo.
OPEC+ consists of OPEC, plus 10 other oil-producing countries (in order of production): Russia, Mexico, Kazakhstan, Oman, Azerbaijan, Malaysia, Bahrain, South Sudan, Brunei, and Sudan. OPEC+ was established in 2016 as rising U.S. shale oil production caused prices to fall dramatically.
The Personal Consumption Expenditures (PCE) Price Index is a measure of the prices that people living in the United States, or those buying on their behalf, pay for goods and services. The PCE price index, released monthly by the U.S. Department of Commerce Bureau of Economic Analysis, is known for capturing inflation or deflation across a wide range of consumer expenses and reflecting changes in consumer behavior.
Price-to-earnings (P/E) ratios measure a company’s current share price relative to its earnings per share. The ratio is used to help assess a company’s value and is sometimes referred to as the price multiple or earnings multiple.
Secular trends are large-scale and ongoing changes in economies and societies that have the potential to drive broad and lasting economic, technological, social or other kinds of changes.
A short squeeze refers to what happens when the price of an asset rises sharply and forces short-sellers who had bet that its price would fall to buy it instead in order to avoid incurring even greater losses. In turn, those purchases put more upward pressure on the asset price.
Spain’s Consumer Price Index, published by the National Statistics Institute, seeks to provide a statistical measurement of the evolution of the set of prices of goods and services that the resident population in family dwellings in Spain consumes. This index is compiled with nearly 210,000 prices reported by some 29,000 establishments distributed in 177 municipalities throughout the country. The data collection on 462 items is carried out in the traditional way (by personal visit to the establishments on the corresponding dates), as well as by telephone and e-mail. In addition, by automated means (such as scanner data or web scrapping), data is collected for another 493 items. For some tariffed items, information is obtained from the corresponding official publications.
S&P Global Flash PMI™ (Purchasing Managers’ Index) reports are produced for various countries by by S&P Global and are based on original survey data collected from companies based in the manufacturing and service sectors. The flash estimates is based on around 85% of total PMI survey responses each month and are designed to provide an accurate advance indication of the final PMI data.
The summary of economic projections (SEP) is produced following meetings of the Federal Open Market Committee and includes meeting participants’ projections of the most likely outcomes for real gross domestic product growth, the unemployment rate, and inflation for a forward-looking three-year window and over the longer run.
A technical resistance level represents a price point that an asset has had trouble exceeding in the time period being considered.
Wall of worry is an expression in finance used to describe stocks that manage to rise even when external factors raise questions about a capital market’s ability to rise.
Indices
The S&P 500 Index measures changes in stock market conditions based on the average performance of 500 widely held common stocks. It is a market-weighted index calculated on a total return basis with dividend reinvested. The S&P 500 represents approximately 80% of the investable U.S. equity market.
The S&P 500® Equal Weight Index is the equal-weight version of the S&P 500. It includes the same constituents as the capitalization-weighted S&P 500, but each company in the S&P 500 Equal Weight Index is allocated a fixed weight, or 0.2% of the index total at each quarterly rebalance.
M-759051 Exp. 10/23/2025
Geopolitical tensions and an expected return of tariff-related trade tensions are fueling uncertainty, but market fundamentals remain supportive.
Matt Orton, CFA, sees diversification across sectors, geographies, and asset classes as essential in navigating unpredictable conditions.
Long-term investment themes like artificial intelligence and global defense spending offer potential secular growth opportunities amid short-term market noise.
Just as investor sentiment was starting to improve and optimism about trade was supporting market gains, another “known unknown” – geopolitical conflict – reared its head.
The spike in oil prices suggests that investors are taking the conflict between Israel and Iran seriously, said Matt Orton, CFA, Chief Market Strategist at Raymond James Investment Management. Safe-haven assets were also in demand last week, with the notable exception of U.S. Treasuries and the dollar. Equity markets also took a breather after a strong run over the past few months, though the pullback was likely in any case given that momentum had started to unwind beneath the surface earlier in the week.1
The market has been climbing an ever-growing wall of worry since its lows in April, and Orton doesn’t expect the spike in geopolitical tensions to alter its progress. The fundamental backdrop remains supportive, he said, and he does not expect the conflict to escalate into an all-out war between Israel and Iran. That said, short-term risks are rising, and a healthy pullback could clear some excess optimism.
Trade tensions are likely to come back to the forefront given the July 9 deadline for the administration’s 90-day pause on reciprocal tariffs and the very few trade deals it has to show so far. The One Big Beautiful Bill Act – the Republicans’ proposed tax and policy bill – also needs to be negotiated and brought to a vote. And earnings season next month should provide more real-time updates on how companies are managing their revenue growth and profit margins through the uncertainty around tariffs.
“It’s not a surprise that the only certainty is uncertainty itself,” Orton said. “I have been advocating all year for investors to consider leaning into diversification and to think about building better balance in portfolios across asset classes, geographies, sectors, and industries. That remains the case today. Don’t chase rallies. Instead, be ready to use downside opportunistically.”
The flare-up of tensions in the Middle East is not a reason to panic, especially for investors who are already well-diversified, Orton said. The good news is that there has been no direct impact on crude oil supplies or demand yet. The market is factoring in a risk premium of about $10 per barrel, similar to previous geopolitical tensions in 2024. Orton said that seems reasonable given what we know today. Each escalation, however, raises the risk of miscalculations that could have broader consequences. For example, 30% of seaborne crude oil flows through the Strait of Hormuz, and any disruption could push oil prices well above $100 per barrel. This scenario seems unlikely, but Orton said it will certainly keep the market on edge and volatility elevated.
Despite the risk premium on crude oil prices, Orton does not expect inflation to rise meaningfully in coming months. May’s Consumer Price Index (CPI) was encouraging with only scattered signs that the cost of higher tariffs was being passed through to goods, while services prices remained soft. Core inflation was slightly lower than expected, rising 0.1% month over month. Meanwhile, Orton said easing financial conditions, improving consumer sentiment, and another month of solid labor market data give investors reasons for greater confidence in the economic outlook, even despite the current uncertainty in the Middle East.
Geopolitical conflict sends oil rapidly higher
Price per barrel of West Texas Intermediate crude oil since 2020
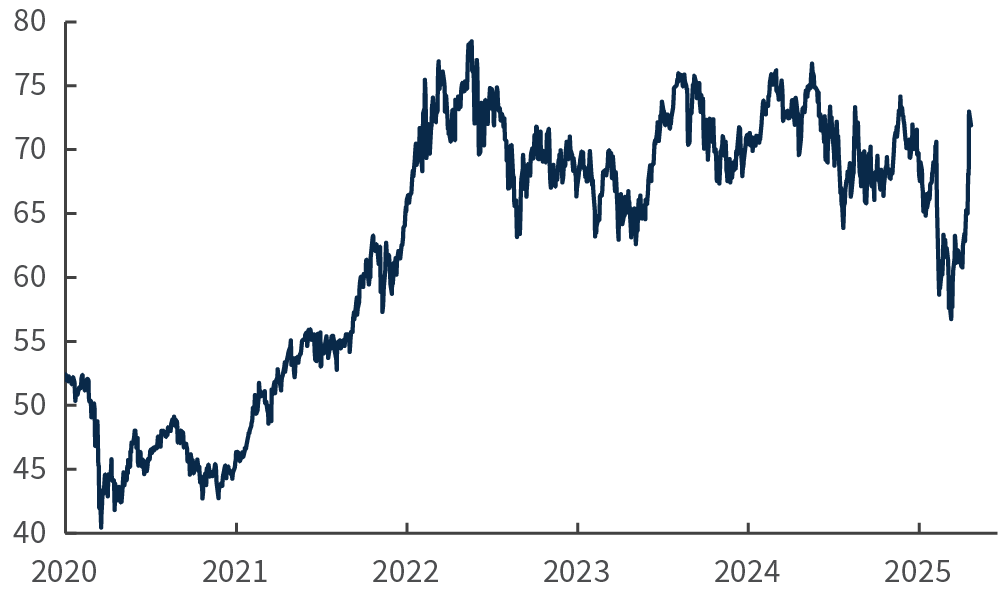
Source: Bloomberg, as of 6/13/25.
It’s also worth discussing the idea of U.S. exceptionalism – or the lack of it – based on how the dollar and Treasuries reacted to the exchange of missiles between Israel and Iran. While the dollar’s recent decline paused on Friday, Orton believes its upside remains limited unless a major market disruption triggers a flight to quality. Ultimately, the dollar’s appeal as a haven is increasingly tempered by investor concerns about U.S. fiscal imbalances, elevated inflation risks, and ongoing uncertainty surrounding the U.S. Federal Reserve’s policy.
“I think the market’s reaction to better than expected inflationary data more recently is too dovish, and I do not think the Fed will be any more dovish this week than expected,” Orton said.
Longer-dated Treasury yields also ticked higher, not lower, on Fri-day. Orton does think there is scope to see a reversal of this trend. Investors currently are more underweight to long-term Treasuries relative to short-term ones than any time in the last 10 years. As we get clarity on trade deals over the next month as well as the final details for the tax and policy bill, a rally in long-term Treasuries could be a “pain trade” as investors temper their sentiment around the idea of the end of U.S. exceptionalism. Indeed, strong demand at 10- and 30-year auctions helped flatten the yield curve last week.
Markets are consolidating as the rebound matures, with Middle East tensions adding a new source of uncertainty. Geopolitical risks likely will determine the extent of this consolidation, and Orton suggested investors think about having their shopping lists ready in the event of a more material decline. Orton also suggests keeping an eye on the rotation in momentum that started last week. A continuation of this trend, combined with elevated uncertainty, could keep a lid on the strength of any rebound. The easy part of the rebound is likely over, Orton said. Consequently, expect selectivity to be increasingly important going forward as performance becomes more dispersed and driven by specific themes. Orton continues to like leaning into long-term durable secular growth themes like artificial intelligence (AI) and its derivatives, beneficiaries of fiscal policy like defense, and adding balance through potential global opportunities:
AI and its derivatives. Artificial intelligence has been one of the most durable secular growth themes, and Orton continues to advocate for building positions in what he calls “AI 2.0.” These are companies tangential to the hyperscalers and the AI infrastructure layer that stand to benefit most from the expected $335 billion in capital expenditures this year. Orton said he would consider buying any dips on near-term stress. U.S. tech remains underweight in global portfolios, and earnings momentum has been accelerating. Orton believes the U.S. tech space is poised to gain support from a combination of light ownership by hedge funds and mutual funds, more reasonable valuations, a defensive earnings profile, and strong share buyback activity expected in July. Defense, another favored trade this year, is getting crowded and expensive, which helps support the case to consider adding to AI now.
Global diversification. Orton said he has never subscribed to the idea that U.S. exceptionalism is dead. Don’t forget the strength of earnings growth in the United States relative to the rest of the world, he said, plus the profit margins that have continued to push higher despite all the tariff uncertainty. Instead, he suggests that Europe and other regions could post strong performance, too. When looking outside the United States, Orton believes that developed international markets can continue to find strength from Europe, particularly in the fundamental improvement across banks as well as in the potential secular growth opportunities that exist in defense. Also, don’t forget about emerging markets, which have benefitted from a weaker U.S. dollar as well as from meaningful growth tailwinds in specific markets. Emerging market central banks are also the most dovish in over a decade, though Orton said a further run in oil prices could be problematic.
Defense. Orton sees European defense companies as an interesting potential long-term growth opportunity as NATO budgets rise and the need for next-generation battlefield solutions leads to a meaningful ramp-up in military spending. Additionally, we’re starting to see an unwinding of sustainable investing regulations in Europe: Sustainable Finance Disclosure funds have increased their exposure to aerospace and defense stocks since March, driving $1.5 billion in inflows year to date, though their exposure still lags that of the STOXX Europe 600 Index. There is still significant capital on the sidelines, with some investors selling due to market hedging. Orton likes the idea of buying dips that favor defense electronics and “sovereignty champions” – defense firms owned in large part by their respective governments and thus poised to benefit directly from increased spending – over pure-play defense companies. The same goes for playing defense in the United States, where Orton sees players in the electronics, software, or drone spaces as more interesting than larger defense contractors.
This week is headlined by the Federal Open Market Committee meeting, one of more than a dozen central bank meetings in four days, though economists don’t expect much to happen:
The U.S. Federal Reserve is likely to strike a note of – perhaps slightly hawkish – caution. Futures are pricing in virtually no chance of an interest rate cut in June, a 17% probability in July, and a 63% chance in September.
The Bank of Japan’s monetary policy meeting will be interesting for its forward guidance and for a possible slowdown in the tapering of its quantitative easing.
The Bank of England is expected to hold its policy rate at 4.25%, but swaps markets are pricing in as much as 75 basis points of cuts in the next 12 months as inflation slows and growth remains sluggish.
We also get May retail sales in the United States. The market will watch to see whether consumption is holding up amid the chaos.
1 Unless otherwise indicated, all data cited is sourced from Bloomberg as of June 13, 2025.
Risk Information:
Investing involves risk, including risk of loss.
Diversification does not ensure a profit or guarantee against loss.
Disclosures:
Link(s) are being provided for informational purposes only. Raymond James Investment Management is not affiliated with and does not endorse, authorize or sponsor any of the listed websites or their respective sponsors. Raymond James Investment Management is not responsible for the content of any website or the collection or use of information regarding any website’s users and/or members
Index or benchmark performance presented in this document does not reflect the deduction of advisory fees, transaction charges, or other expenses, which would reduce performance. Indexes are unmanaged. It is not possible to invest directly in an index. Any investor who attempts to mimic the performance of an index would incur fees and expenses that would reduce return.
This document is a general communication being provided for informational purposes only. It is educational in nature and not designed to be taken as advice or a recommendation for any specific investment product, strategy, plan feature, or other purpose in any jurisdiction, nor is it a commitment from Raymond James Investment Management or any of its affiliates to participate in any of the transactions mentioned herein. Any examples used are generic, hypothetical, and for illustration purposes only. This material does not contain sufficient information to support an investment decision, and you should not rely on it in evaluating the merits of investing in any securities or products. In addition, users should make an independent assessment of the legal, regulatory, tax, credit, and accounting implications and make their own determinations together with their own professionals in those fields. Any forecasts, figures, opinions, or investment techniques and strategies set out are for information purposes only, based on certain assumptions and current market conditions, and are subject to change without prior notice. All information presented herein is considered to be accurate at the time of production, but no warranty of accuracy is given and no liability in respect of any error or omission is accepted. It should be noted that investment involves risks, the value of investments and the income from them may fluctuate in accordance with market conditions and taxation agreements, and investors may not get back the full amount invested. Both past performance and yields are not reliable indicators of current and future results.
The views and opinions expressed are not necessarily those of the broker/dealer or any affiliates. Nothing discussed or suggested should be construed as permission to supersede or circumvent any broker/dealer policies, procedures, rules, and guidelines.
Sector investments are companies engaged in business related to a specific sector. They are subject to fierce competition and their products and services may be subject to rapid obsolescence. There are additional risks associated with investing in an individual sector, including limited diversification.
Investing in small cap stocks generally involves greater risks, and therefore, may not be appropriate for every investor. The prices of small company stocks may be subject to more volatility than those of large company stocks.
International investing presents specific risks, such as currency fluctuations, differences in financial accounting standards, and potential political and economic instability. These risks are further accentuated in emerging market countries where risks can also include possible economic dependency on revenues from particular commodities or on international aid or development assistance, currency transfer restrictions, and liquidity risks related to lower trading volumes.
Investing in bonds involves risks that may adversely affect the value of your investment such as inflation risk, credit risk, call risk, interest rate risk, and liquidity risk, among others. The two most prominent factors are interest rate movements and the credit worthiness of the bond issuer. Investors should pay careful attention to the types of fixed income securities that comprise their portfolios and remember that, as with all investments, there is the risk of loss of capital.
Definitions
American exceptionalism, also known as U.S. exceptionalism, is an idea centered on the notion that the United States is a unique and even superior nation as a result of historical, ideological, religious, and/or, in the context of finance, economic reasons. Proponents of American exceptionalism often expect or advocate for the United States to occupy or play a leading role in global affairs.
Artificial intelligence (AI) is technology that enables computers and machines to simulate human learning, comprehension, problem solving, decision making, creativity and autonomy.
Basis points (bps) are measurements used in discussions of interest rates and other percentages in finance. One basis point is equal to 1/100th of 1%, or 0.01%.
Capital expenditures, or capex, are monies used by a company to buy, improve, or maintain physical assets such as real estate, facilities, technology, or equipment, and may include new projects or investments.
Consolidation is a term used in technical analysis to describe when stocks reverse previous gains (or losses) to stay within well-defined trading levels.
The U.S. Consumer Price Index (CPI) measures the change in prices paid by consumers for goods and services. The U.S. Bureau of Labor Statistics bases the index on prices of food, clothing, shelter, fuels, transportation, doctors’ and dentists’ services, drugs, and other goods and services that people buy for day-to-day living. Prices are collected each month in 75 urban areas across the country from about 6,000 households and 22,000 retailers.
Core inflation measures generally exclude prices that are considered to be more volatile and thus less useful for tracking more durable trends inflation, including prices for food and, in many instances, fuel.
Defensive stocks provide consistent dividends and stable earnings regardless of whether the overall stock market is rising or falling. Companies with shares considered to be defensive tend to have a constant demand for their products or services and thus their operations are more stable during different phases of the business cycle.
Dispersion refers to the range of outcomes in different areas of a financial market or to the potential outcomes of investments based on historical volatility or returns.
Dovish, hawkish, and centrist are terms used to describe the monetary policy preferences of central bankers and others. Doves tend to support maintaining lower interest rates, often in support of stimulating job growth and the economy more generally. Hawks prioritize controlling inflation and may favor raising interest rates to reduce it or keep it in check. Centrists tend to occupy the middle of the continuum between tight (hawkish) and loose (dovish) monetary policy.
Earnings per share (EPS) is calculated as a company’s profit divided by the outstanding shares of its common stock. The resulting number serves as an indicator of a company’s profitability.
The Federal Open Market Committee (FOMC) consists of 12 members: the seven members of the Board of Governors of the Federal Reserve System; the president of the Federal Reserve Bank of New York; and four of the remaining 11 Reserve Bank presidents, who serve one-year terms on a rotating basis. The FOMC holds eight regularly scheduled meetings per year at which it reviews economic and financial conditions, determines the appropriate stance of monetary policy, and assesses the risks to its long-run goals of price stability and sustainable economic growth.
Fiscal policy refers to the tax collection and spending a government uses to influence its country’s economy.
Forward guidance in monetary policy refers to statements and projections from central banks or central bank officials about the potential or likely paths of future interest rates or other decisions related to monetary policy.
Fund flow is the net of all cash inflows and outflows into and out of a particular financial asset, sector, or index. It typically is measured on a quarterly or monthly basis. Investors and others look at the direction of fund flows for indications about the health of specific securities and sectors or the overall market.
Futures markets are auction markets where investors buy and sell commodity and futures contracts. A futures contract is a legal agreement to buy or sell an asset at a predetermined price at a specified time in the future, which is known as the expiration date. Futures contracts are financial derivatives that allow investors to speculate on the direction of a particular asset and are often used to hedge the price movement of the underlying asset to help prevent losses from undesired price changes.
A hedge is an investment or investment strategy that is designed to lessen the potential for losses in other investments. The price of an investment considered to be a hedge often moves in the opposite direction of the prices of the investments being hedged.
Hyperscalers refers to the largest cloud computing providers that can provide massive amounts of computing resources and storage at enterprise scale.
Known unknowns refer to identified areas of potential risk with uncertainty surrounding the timing, scope of impact, or path of development for those risks.
Momentum investing is a strategy that aims to capitalize on the continuance of an existing market trend. It is a trading strategy in which investors buy securities that are already rising and look to sell them when they look to have peaked. It entails taking long positions on financial instruments with prices trending up and short positions on instruments with prices trending down.
Monetary policy refers to the decisions made by central banks to raise or lower benchmark interest rates or otherwise tighten or loosen credit to influence an economy’s growth, inflation, or employment levels.
NATO, or the North Atlantic Treaty Organization, is a political and military alliance of 32 countries from Europe and North America that is organized to guarantee their security and cooperation.
The One, Big, Beautiful Bill Act refers to a proposed congressional bill that would raise the U.S. debt ceiling by $4 trillion, as well as make permanent tax cuts created by the Tax Cuts and Jobs Act of 2017, change a wide range of other aspects of federal tax policy, eliminate taxes on tips, overtime, car loan interest, make changes to health insurance legislation, phase out or reduce credits for clean energy production or use, and remove tax benefits for illegal immigrants, among other things.
Pain trade refers to trades, market movements, or asset classes where investor positioning – often crowded as investors have moved en masse into a particular strategy – becomes increasingly uncomfortable for investors to pursue or maintain on a widespread basis.
Positioning refers to assessments of whether professional investors are, on the whole, bullish or bearish on a particular security, industry, sector, market capitalization or other area of the market, as reflected by the extent to which they are invested in the area of the market in question.
A policy rate is an interest rate set by a central bank or other monetary authority to influence the evolution of an economy’s monetary variables such as consumer prices, exchange rates, or credit expansion.
A pullback is a temporary pause or drop in the price of a security that previously had been rising.
Pure-play companies focus their businesses in a single industry.
Quantitative easing (QE) is a form of unconventional monetary policy in which a central bank purchases longer-term securities from the open market in order to increase the money supply and encourage lending and investment. Buying these securities adds new money to the economy, and also serves to lower interest rates by bidding up fixed-income securities. It also expands the central bank’s balance sheet.
The Retail Sales Report is a monthly U.S. Census Bureau report that seeks to provide current estimates of sales at retail and food services stories and inventories held by retail stores, based on a survey of about 13,000 retail businesses, supplemented by estimates for other employers.
A risk premium is the investment return an asset is expected to yield in excess of the risk-free rate of return. Risk premiums are assigned to assets to cover the effects of external influences on asset prices, such as inflation, monetary policy, and economic or geopolitical events.
Rotation describes the movement of investments in securities from one industry, sector, factor, or asset class to another as market participants react to or try to anticipate the next stage of the economic cycle.
Secular trends are large-scale and ongoing changes in economies and societies that have the potential to drive broad and lasting economic, technological, social or other kinds of changes.
Sovereignty champions refers to companies, often in the aerospace and defense industry, that have large or majority ownership stakes by their respective governments and that as a result are in a position to benefit from government investments in their sector.
The Sustainable Finance Disclosure Regulation (SFDR) is a set of European Union rules that require financial market participants to disclose sustainability information so that investors can make informed choices about putting their money into companies and projects that support sustainability objectives.
Sustainable investing refers to Environmental, Social, and Governance factors used in measuring the sustainability and societal impact of an investment in a company or business. A sustainable investment strategy will include only holdings deemed consistent with those applicable guidelines. As a result, the universe of investments available to the strategy will be more limited than strategies not applying such guidelines.
Swaps markets is a term for the over-the-counter market between private parties (usually firms and financial institutions) to trade in swaps, which are customized contracts between two parties to exchange sequences of cash flows (as from forward contracts or bonds) for a set period of time.
Tailwind is a term used to describe events or market forces that exert a positive influence on an investment’s performance.
Underweight describes a portfolio position in an industry sector or some other category that is less than the corresponding weight level in a benchmark portfolio.
Unwinding describes the process of closing out what is often a large or complicated trading position.
A “wall of worry” is an expression in finance used to describe stocks that manage to rise even when external factors raise questions about a capital market’s ability to rise.
West Texas Intermediate crude oil is a grade of light, sweet crude oil that is considered to be of high quality and easy to refine. It is one of three benchmarks used in pricing oil, along with the Brent and Dubai Crude benchmarks. West Texas Intermediate crude is the underlying commodity of the New York Mercanile Exchange’s oil futures contract.
A yield curve is a line that plots yields (interest rates) of bonds having equal credit quality but differing maturity dates. The slope of the yield curve gives an idea of future interest rate changes and economic activity. Yield curve flattening describes the convergence of interest rates along the curve.
Indices
The STOXX® Europe 600 Index represents 600 large-, mid- and small-capitalization companies across 17 European countries: Austria, Belgium, Denmark, Finland, France, Germany, Ireland, Italy, Luxembourg, the Netherlands, Norway, Poland, Portugal, Spain, Sweden, Switzerland, and the United Kingdom.
M-756625 Exp. 10/16/2025
U.S. equities remain resilient despite global skepticism and political noise, supported by strong economic data and earnings.
The case for global diversification is supported by rising prospects for growth in areas such as Europe and India and the added tailwind of a falling dollar.
Durable secular growth trends, especially in artificial intelligence, and recent gains in small-cap stocks continue to support growing breadth in the U.S. equity market.
Global equities as represented by the MSCI ACWI (All-Country World Index) continue to scale the wall of worry, hitting a new all-time high to close last week.1
Meanwhile, predictions of a downturn in U.S. equities look overstated based on strong capital inflows and resilient economic indicators, said Matt Orton, CFA, Chief Market Strategist at Raymond James Investment Management. The idea that hard economic data would have to decline to match the more pessimistic soft data always seemed like a tall tale that bearish investors have tried to keep alive.
Additionally, Orton believes the high-profile breakup between President Trump and Elon Musk could help to keep the president focused more on a path forward for proposed domestic legislation than on tariffs.
“I see negative sentiment and portfolio positioning that is out of step with larger economic trends as setting up potential tailwinds to help this rally continue,” he said.
After spending the past week abroad talking to global investors, many based outside of the United States, Orton said he was a little surprised by the level of pessimism toward the U.S. market. Nearly everyone he met was caught off-guard by the speed of the recovery, and now they are starting to feel a need to buy even the shallowest of dips.
Orton suspects this may be the case for many domestic investors as well. While many U.S. mega-cap companies have rebounded strongly, he noted that there also has been improving breadth, which is critical to sustaining a bull market. Smaller companies, which he sees as a better signal for the macro economy than large caps, likewise are starting to improve. International developed and emerging markets also continue to do well, highlighting that it was never accurate to look at the U.S. versus everything else as a zero-sum game.
“While I remain optimistic and continue to advocate for thinking about building better balance in portfolios, I would continue to avoid chasing rallies and to wait for pullbacks to consider deploying new capital,” he said.
The merits of staying invested: Global equities are back at all-time highs despite the pessimism
MSCI ACWI (All-Country World Index) since 2021
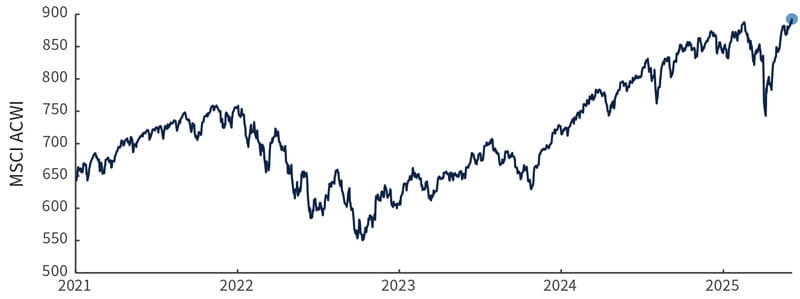
Source: Bloomberg, as of 6/6/25.
The debate around the end of U.S. exceptionalism is very nuanced, and Orton thinks it’s too soon to come to any conclusions. Some key drivers of U.S. exceptionalism appear to remain firmly in place, he said. These include innovation in artificial intelligence (AI) as well as a dynamic and resilient corporate sector. Inflows to U.S. stocks have also continued, even since President Trump’s “Liberation Day” tariff announcement on April 2. U.S. inflows are on a pace to reach $138 billion for all of 2025, which would be the second-largest annual inflow ever. While global capital might not be leaving, investors have noticed that current U.S. policies have forced other countries to make some positive changes to their own fiscal policies. The MSCI EAFE (Europe, Australasia, and the Far East) Net Index is up nearly 20% year to date (YTD) and is 5.7% above its pre-Liberation Day highs while the S&P 500 Index is up only 2.6% YTD and is still down 2.3% from its all-time high. So, rather than selling from the U.S., it appears that the marginal investment dollar is more likely to go to Europe: data since Liberation Day shows inflows to European equities of 1.1% of assets under management (AUM) versus 0.1% of AUM for U.S. equities. That said, scale differences between the two regions are huge, with U.S. equity AUM at $12.5 trillion versus European AUM at $1.8 trillion. This is a key reason why Orton said he remains optimistic about the potential diversification opportunities offered by having a global allocation in portfolios.
Last week marked the two-month anniversary of Liberation Day. While the event itself felt like a cataclysm, Orton noted that both U.S. markets and U.S. economic data have since held up much better than many investors expected. The 10-year U.S. Treasury yield is up 30 basis points (bps) since Liberation Day and the 2-year yield is up 15 bps, while the S&P 500 has gained about 5.5% following a strong first-quarter earnings season and hard economic data that has been fairly robust.
There has also been a lot of concern about the fiscal impact of the proposed One Big Beautiful Bill Act, along with the bill’s potential to fuel an increase in real interest rates that eventually would be expected to feed into the economy and equity market.
“I increasingly believe that further moves in real yields could lead to weaker growth or Treasury market instability that would eventually draw policy support from the U.S. Federal Reserve and/or the Treasury,” Orton said. “Additionally, we cannot ignore the potential positive growth impact from the proposed bill that could provide further stimulus to the equity market.”
With few economic reports due this week and the Fed in a blackout period ahead of next week’s June meeting of the Federal Open Market Committee, Orton believes the likely path of the stock market remains higher — especially if it’s a quiet week from the White House on Truth Social. Earnings over the past few weeks have been broadly positive, particularly for companies with significant exposure to durable secular growth themes like artificial intelligence. Cyclicals, especially semiconductor companies, are seeing rising share prices that don’t reflect the bear narrative that the U.S. economy is heading toward a meaningful slowdown. Additionally, small caps are showing some signs of life. Sentiment remains depressed, but it has reversed from apocalyptic levels just two months ago. Accordingly, areas that Orton is watching include:
Potential global diversification opportunities. The case for global equities to continue performing well remains in place, Orton said. Developed international markets could continue to find strength from Europe, particularly from the fundamental improvement across banks as well as the potential secular growth opportunity in defense. Orton believes that European defense represents an interesting long-term growth opportunity as NATO budgets rise and the need for next-generation military solutions is expected to lead to a meaningful ramp up in spending. Meanwhile, emerging markets have also benefitted from a weaker U.S. dollar as well as from meaningful growth tailwinds in specific markets. Orton met with management teams from some of the largest Indian companies last week, and he said he left even more excited about the long-term prospects for growth in the world’s fourth-largest economy. He sees India as a long-term growth market in which he believes global indices remain underinvested.
Long-term secular growth trends. Orton sees the current environment — as characterized by strong underlying fundamentals and whipsawing headlines and market narratives — as highly favorable for considering investments in durable growth trends. Focusing on growth durability appears to have been more productive than dwelling on noise and extreme narratives so far this year, and Orton expects that to continue going forward. One of the most durable drivers of growth right now is AI, as the hyperscalers have all posted strong earnings and guidance and reaffirmed their capital expenditure budgets for the rest of 2025. This has enabled companies poised to be secondary beneficiaries of AI to surge higher, providing a ballast to some of the most cyclical parts of portfolios that have been wrapped up in noise around headlines.
Smaller companies. The AI trade has been the backbone of the large-cap market, and continued bearishness with respect to the economy led earlier this year to some very challenging performance down the market-cap spectrum. But Orton noted that the Russell 2000® Index is up more than 21% from its April lows and is above pre-Liberation Day levels. For investors looking for ways to both diversify portfolios and lean into risk, Orton believes smaller companies could fit the bill. Valuations relative to large caps remain historically attractive and interest rates, while elevated, don’t pose an existential threat to the businesses of smaller companies. In fact, he noted that half of the Russell 2000’s debt is held by just over 100 of its companies, most of which are concentrated in communications services, utilities, and industrials. Over a third of the index is net cash positive, undercutting the prevailing narrative that variable rate debt poses a crushing burden to small caps. This is an area where Orton would argue that stocks appear to have bottomed. The balance of risk and reward suggests considering whether to slowly wade into small caps, he said.
With the Fed in its blackout period, inflation data across the United States, China, and the U.K. will be in the spotlight. The U.S. Consumer Price Index is expected to show deflation in services even as tariffs add inflationary pressure for goods.
U.S. Treasury auctions, including for 10- and 30-year bonds, will serve as another test of demand for duration.
1 Unless otherwise indicated, all data cited is sourced from Bloomberg as of June 6, 2025.
Risk Information:
Investing involves risk, including risk of loss.
Diversification does not ensure a profit or guarantee against loss.
Disclosures:
Link(s) are being provided for informational purposes only. Raymond James Investment Management is not affiliated with and does not endorse, authorize or sponsor any of the listed websites or their respective sponsors. Raymond James Investment Management is not responsible for the content of any website or the collection or use of information regarding any website’s users and/or members
Index or benchmark performance presented in this document does not reflect the deduction of advisory fees, transaction charges, or other expenses, which would reduce performance. Indexes are unmanaged. It is not possible to invest directly in an index. Any investor who attempts to mimic the performance of an index would incur fees and expenses that would reduce return.
This document is a general communication being provided for informational purposes only. It is educational in nature and not designed to be taken as advice or a recommendation for any specific investment product, strategy, plan feature, or other purpose in any jurisdiction, nor is it a commitment from Raymond James Investment Management or any of its affiliates to participate in any of the transactions mentioned herein. Any examples used are generic, hypothetical, and for illustration purposes only. This material does not contain sufficient information to support an investment decision, and you should not rely on it in evaluating the merits of investing in any securities or products. In addition, users should make an independent assessment of the legal, regulatory, tax, credit, and accounting implications and make their own determinations together with their own professionals in those fields. Any forecasts, figures, opinions, or investment techniques and strategies set out are for information purposes only, based on certain assumptions and current market conditions, and are subject to change without prior notice. All information presented herein is considered to be accurate at the time of production, but no warranty of accuracy is given and no liability in respect of any error or omission is accepted. It should be noted that investment involves risks, the value of investments and the income from them may fluctuate in accordance with market conditions and taxation agreements, and investors may not get back the full amount invested. Both past performance and yields are not reliable indicators of current and future results.
The views and opinions expressed are not necessarily those of the broker/dealer or any affiliates. Nothing discussed or suggested should be construed as permission to supersede or circumvent any broker/dealer policies, procedures, rules, and guidelines.
Sector investments are companies engaged in business related to a specific sector. They are subject to fierce competition and their products and services may be subject to rapid obsolescence. There are additional risks associated with investing in an individual sector, including limited diversification.
Investing in small cap stocks generally involves greater risks, and therefore, may not be appropriate for every investor. The prices of small company stocks may be subject to more volatility than those of large company stocks.
International investing presents specific risks, such as currency fluctuations, differences in financial accounting standards, and potential political and economic instability. These risks are further accentuated in emerging market countries where risks can also include possible economic dependency on revenues from particular commodities or on international aid or development assistance, currency transfer restrictions, and liquidity risks related to lower trading volumes.
Investing in bonds involves risks that may adversely affect the value of your investment such as inflation risk, credit risk, call risk, interest rate risk, and liquidity risk, among others. The two most prominent factors are interest rate movements and the credit worthiness of the bond issuer. Investors should pay careful attention to the types of fixed income securities that comprise their portfolios and remember that, as with all investments, there is the risk of loss of capital.
Definitions
American exceptionalism, also known as U.S. exceptionalism, is an idea centered on the notion that the United States is a unique and even superior nation as a result of historical, ideological, religious, and/or, in the context of finance, economic reasons. Proponents of American exceptionalism often expect or advocate for the United States to occupy or play a leading role in global affairs.
Ballast, in finance, can refer to characteristics, factors or trading strategies that mitigate volatility or provide stability to a security or group of securities. The phrase, “the benchmark is not the ballast,” refers to risk of believing that the universe of securities within a single index provide the level of stability that investors might seek from subgroups of securities within the index.
Basis points (bps) are measurements used in discussions of interest rates and other percentages in finance. One basis point is equal to 1/100th of 1%, or 0.01%.
Breadth describes the relationship between the median and the mean of a market index. When a few data outliers result in a mean that is substantially larger (or smaller) than the median of the full data set, then the performance of the entire index is being driven by a “narrow” selection of companies. An index supported by “broad” market movements is one where the median is closer to the mean. Market breadth is said to narrow when a smaller number of more extreme outliers drive the mean of an index further from its median.
Capital expenditures, or capex, are monies used by a company to buy, improve, or maintain physical assets such as real estate, facilities, technology, or equipment, and may include new projects or investments.
The U.S. Consumer Price Index (CPI) measures the change in prices paid by consumers for goods and services. The U.S. Bureau of Labor Statistics bases the index on prices of food, clothing, shelter, fuels, transportation, doctors’ and dentists’ services, drugs, and other goods and services that people buy for day-to-day living. Prices are collected each month in 75 urban areas across the country from about 6,000 households and 22,000 retailers.
Cyclical stocks have prices influenced by macroeconomic changes in the economy and are known for following the economy as it cycles through expansion, peak, recession, and recovery.
Duration incorporates a bond’s yield, coupon, final maturity, and call features into one number, expressed in years, that indicates how price-sensitive a bond or portfolio is to changes in interest rates. Bonds with higher durations carry more risk and have higher price volatility than bonds with lower durations.
Earnings per share (EPS) is calculated as a company’s profit divided by the outstanding shares of its common stock. The resulting number serves as an indicator of a company’s profitability.
The Federal Open Market Committee (FOMC) consists of 12 members: the seven members of the Board of Governors of the Federal Reserve System; the president of the Federal Reserve Bank of New York; and four of the remaining 11 Reserve Bank presidents, who serve one-year terms on a rotating basis. The FOMC holds eight regularly scheduled meetings per year at which it reviews economic and financial conditions, determines the appropriate stance of monetary policy, and assesses the risks to its long-run goals of price stability and sustainable economic growth. The FOMC observes a blackout period, which begins at midnight of the second Saturday before each meeting. During the blackout periods, committee members do not make public comments about macroeconomic developments or monetary policy issues.
Fund flow is the net of all cash inflows and outflows into and out of a particular financial asset, sector, or index. It typically is measured on a quarterly or monthly basis. Investors and others look at the direction of fund flows for indications about the health of specific securities and sectors or the overall market.
Guidance refers to statements from the managers of publicly traded companies that indicate whether they expect to realize near-term profits or losses and why.
Hard data in economics refers to objective, quantifiable measurements of economic activity. Hard data is backward-looking and takes time and effort to collect and verify.
Hyperscalers refers to the largest cloud computing providers that can provide massive amounts of computing resources and storage at enterprise scale.
Investment-grade refers to fixed-income securities rated BBB or better by Standard & Poor’s or Baa or better by Moody’s.
Liberation Day is a term used by President Donald Trump to refer to April 2, 2025, when he announced a wide range of unexpectedly high tariffs on many U.S. trading partners, triggering a global selloff of risk assets.
A marginal dollar of investment refers to a dollar of investment that could have lower returns than earlier investments made by an investor.
Market capitalization, or market cap, refers to the total dollar market value of a company’s outstanding shares of stock.
Mega-cap stocks are the largest publicly traded companies as measured by market capitalization. Generally, this refers to companies with market capitalizations over $200 billion.
NATO, or the North Atlantic Treaty Organization, is a political and military alliance of 32 countries from Europe and North America that is organized to guarantee their security and cooperation.
Net cash flow is measured by subtracting total cash outflows from total cash inflows. A positive net cash flow indicates that inflows exceed outflows, a sign of health for the company being considered.
The One, Big, Beautiful Bill Act refers to a proposed congressional bill that would raise the U.S. debt ceiling by $4 trillion, as well as make permanent tax cuts created by the Tax Cuts and Jobs Act of 2017, change a wide range of other aspects of federal tax policy, eliminate taxes on tips, overtime, car loan interest, make changes to health insurance legislation, phase out or reduce credits for clean energy production or use, and remove tax benefits for illegal immigrants, among other things.
Positioning refers to assessments of whether professional investors are, on the whole, bullish or bearish on a particular security, industry, sector, market capitalization or other area of the market, as reflected by the extent to which they are invested in the area of the market in question.
A pullback is a temporary pause or drop in the price of a security that previously had been rising.
A real interest rate is an interest rate that has been adjusted to remove the effects of inflation. Once adjusted, it reflects the real cost of funds to a borrower and the real yield to a lender or to an investor. A real interest rate reflects the rate of time preference for current goods over future goods. For an investment, a real interest rate is calculated as the difference between the nominal interest rate, which is not adjusted for inflation, and the inflation rate.
Secular trends are large-scale and ongoing changes in economies and societies that have the potential to drive broad and lasting economic, technological, social or other kinds of changes.
Soft data reflects the results of surveys of consumers or other participants in the economy, as well as indices focused on sentiment and expectations. Soft data tends to be forward-looking, providing indications about the direction of existing trends.
Tailwind is a term used to describe events or market forces that exert a positive influence on an investment’s performance.
The Tax Cuts and Jobs Act (TCJA) of 2017 was a sweeping revision of the U.S. tax code that reduced taxes for individuals and businesses. The changes for businesses created a single flat corporate tax rate of 21% and also affected deductions, depreciation, expensing, tax credits, and other tax items that affect businesses. The corporate tax cut is permanent. The individual tax cuts are scheduled to expire in 2025.
Variable rate debt consists of loans with interest rates that are tied to an underlying benchmark interest rate and thus change over time as the underlying benchmark rate fluctuates.
A “wall of worry” is an expression in finance used to describe stocks that manage to rise even when external factors raise questions about a capital market’s ability to rise.
A zero-sum game is a set of circumstances where a gain for any one party results in a loss for another.
Indices
The MSCI ACWI® (All Country World Index) measures the performance of large and mid-cap stocks across 23 developed markets (DM) and 24 emerging markets (EM) countries. Developed market countries include: Australia, Austria, Belgium, Canada, Denmark, Finland, France, Germany, Hong Kong, Ireland, Israel, Italy, Japan, Netherlands, New Zealand, Norway, Portugal, Singapore, Spain, Sweden, Switzerland, the United Kingdom and the United States. Emerging market countries include: Brazil, Chile, China, Colombia, Czech Republic, Egypt, Greece, Hungary, India, Indonesia, Korea, Kuwait, Malaysia, Mexico, Peru, Philippines, Poland, Qatar, Saudi Arabia, South Africa, Taiwan, Thailand, Turkey and United Arab Emirates.
The MSCI EAFE (Europe, Australasia, and the Far East) Net Index measures the performance of performance of large and mid-cap securities across 21 developed markets, including countries in Europe, Australasia and the Far East, excluding the U.S. and Canada. The MSCI EAFE Net Index subtracts any foreign taxes applicable to US citizens but not applicable to citizens in the overseas country.
The Russell 2000® Index measures the performance of the 2,000 smallest companies in the Russell 3000® Index, which represents approximately 7% of the total market capitalization of the Russell 3000® Index.
The S&P 500 Index measures changes in stock market conditions based on the average performance of 500 widely held common stocks. It is a market-weighted index calculated on a total return basis with dividend reinvested. The S&P 500 represents approximately 80% of the investable U.S. equity market.
London Stock Exchange Group plc and its group undertakings (collectively, the “LSE Group”).© LSE Group 2025. FTSE Russell is a trading name of certain of the LSE Group companies. Russell® is a trade mark of the relevant LSE Group companies and is used by any other LSE Group company under license. All rights in the FTSE Russell indexes or data vest in the relevant LSE Group company which owns the index or the data. Neither LSE Group nor its licensors accept any liability for any errors or omissions in the indexes or data and no party may rely on any indexes or data contained in this communication. No further distribution of data from the LSE Group is permitted without the relevant LSE Group company’s express written consent. The LSE Group does not promote, sponsor, or endorse the content of this communication.
M-752727 Exp. 10/9/2025
The U.S. Court of International Trade blocked the majority of U.S. President Donald Trump’s tariffs for less than 24 hours before a federal appeals court paused the ruling.
The U.S. Federal Reserve (Fed) stressed that its path of policy will depend entirely on incoming economic information.
Volatility will likely increase as budget legislation evolves through the senate and the legality of Trump’s tariffs are questioned.
Despite the markets being closed on Memorial Day, last week was one of the busiest news weeks of the year. Markets opened on Tuesday with a mini trade war between the United States and the European Union, which had begun after Friday’s close.1
“The most narrative-altering news broke on Wednesday, when the U.S. Court of International Trade (CIT) blocked Trump’s International Emergency Economic Powers Act (IEEPA)-induced tariffs,” said Joey Del Guercio, CFA, Market Strategy Research Associate at Raymond James Investment Management. These were the fentanyl-focused tariffs and “reciprocal” tariffs announced on April 2, which affected more than 60 U.S. trading partners.
“This was huge news for less than 24 hours, and then a federal appeals court paused the CIT’s ruling, restoring Trump’s ability to leverage IEEPA and reinstate the tariffs,” Del Guercio said.
The ruling may have overshadowed gross domestic product (GDP) data, a Personal Consumption Expenditures (PCE) Price Index update, and an earnings report from NVIDIA, the largest company in the world by market capitalization. Each of these releases can command investor attention, but Del Guercio feels like they were almost entirely deprioritized last week. He believes that last week’s changing priorities were a reminder that uncertainty is here to stay.
“While I expect this uncertainty to persist, it feels like the market is getting increasingly calibrated to all of the noise, which I expect to continue going forward,” said Del Guercio. “Despite all the uncertainty in the news, the CBOE Volatility Index (VIX) is only mildly elevated, and the S&P 500 Index had its best month since 2023 and its best May since 1990.”
Following its torrid rally from the depths of the Liberation Day aftermath, the S&P 500 Index remains down 4% from its February all-time high, and Del Guercio thinks it’s reasonable to expect some short-term consolidation in equities. Given this outlook, he maintains that investors would be wise to avoid chasing this market higher. Instead, they might consider remaining patient and opportunistically building positions on pullbacks.
“From my view, it’s increasingly apparent that the Fed is in absolutely no rush to cut its policy rate,” said Del Guercio. “Last week, both core and headline inflation showcased further disinflation, and super core PCE declined month-over-month for the first time since 2020.” However, given all the potential first-, second-, and third-order effects of trade and greater fiscal policy, Del Guercio said that investors have acquired little to none of the clarity that the Fed finds necessary to cut interest rates.
Del Guercio said that another event failing to receive the coverage it deserved last week was U.S. President Donald Trump meeting with Fed Chair Jerome Powell for the first time since inauguration day. Following the closed-door meeting, the Fed put out a brief statement explicitly stressing that “the path of policy will depend entirely on incoming economic information.” Then, the White House press secretary reiterated the Trump administration’s belief that the Fed Chair is making a mistake by not lowering interest rates.
“In my opinion, the Fed is in a comfortable position to wait, and Powell is under no real political pressure to cut rates,” said Del Guercio. “Should a recession materialize, the man who put tariffs on 60 countries would likely get the blame, not the man who kept rates steady in the face of above-target inflation and resilient growth.”
Del Guercio thinks that a sustained deterioration in the labor market would be the biggest inspiration for a Fed cut. This week’s labor data from the Job Openings and Labor Turnover Survey (JOLTS), ADP® National Employment Report™, and Non-Farm Payrolls (NFP) report will hold important insights.
Del Guercio said that last week’s earnings results from NVIDIA capped off a first quarter in which S&P 500 Index constituents reported earnings that were broadly better than expected. 10 of the 11 sectors in the S&P 500 Index posted earnings per share (EPS) growth that exceeded consensus pre-season earnings estimates. The broader index posted its second straight quarter of double-digit EPS growth. Over 60% of the companies reported a positive revenue surprise, and more than three quarters of the companies posted a positive EPS surprise.
“NVIDIA’s earnings were another reminder that Artificial Intelligence (AI) is here to stay. The massive amount of capital expenditure (capex) dollars being spent to build out the AI ecosystem are persistent with interest in the space accelerating,” said Del Guercio. “Despite all the talk about prudent capital decision planning in the face of Trump’s tariffs, capex beneficiaries continue to grow their backlogs.”
Now that the market is firmly between earnings seasons, Del Guercio believes that investor focus will increasingly shift towards policy news and long-term investment themes, which are somewhat interconnected. This was demonstrated in headlines from two weeks ago claiming that Trump’s nuclear power policy sent myriads of related equities up +20-30% in a single day.
“Other thematic areas like AI enablers, the hyperscalers, cybersecurity, and defense have already corrected,” said Del Guercio. “With sentiment on the mend, I think it makes sense to consider leaning into long-term megatrends by opportunistically buying on dips.”
Del Guercio expects policy uncertainty to continue driving the chief market narrative. Volatility is likely to increase from here as U.S. budget legislation evolves through the senate and the legality of Trump’s tariffs are questioned. If Trump loses his IEEPA privileges, he has other avenues to pivot to, including Section 301 and Section 232.
“Fade the short-term, whiplash-inducing news flow and consider leaning into long-term durable market trends that are agnostic to short-term policy narratives — like AI and defense spending. Above all else, consider keeping portfolios diversified to not get caught offsides should volatility spike,” said Del Guercio.
Small- and mid-caps. While last week’s court decisions weren’t the clean relaxation of trade policy Del Guercio was looking for, he thinks the continued progress could suppress recession fears in the short-term, which have been a major hurdle down market cap. “Small caps continue to disappoint, but I think the risk/reward is too favorable to ignore the gaping valuation differential versus large caps,” Del Guercio said. “Mid caps continue to perform well year to date, and I expect this strong performance to continue as quality-biased investors move down market cap.”
Industrials. Del Guercio thinks it still makes sense to consider leaning into cyclicals and higher beta securities broadly when dips present themselves, but he is largely focused on industrials. In his opinion, industrials have somewhat sneakily become the second-best performing S&P 500 Index sector year to date, only lagging utilities. Many industrial companies are levered to long-term trends with multi-year tailwinds, like aerospace and defense, domestic manufacturing, and AI’s expeditiously growing infrastructure.
International. Del Guercio made the case for ratcheting up exposure to international equities as markets continue to question U.S. exceptionalism. To be clear, the U.S. is still his favored region, but a continuation of the dollar’s decline and elevated domestic yields bode well for international equities. “With the U.S. still comprising about 63% of the MSCI All Country World Index, large gains can accrue to markets that catch a marginal reallocation away from domestic equities,” said Del Guercio. Despite their strong performance, financials in general and mainly European defense names remain his favored areas of interest.
This week focuses on labor data: JOLTS on Tuesday, the ADP Employment Report on Wednesday, and weekly jobless claims, productivity, and unit labor costs data on Thursday. The Non-Farm Payrolls report will be released on Friday along with unemployment data. U.S. Manufacturing and Services Purchasing Managers’ Index (PMI) data will also be released this week. And on Thursday, the European Central Bank will announce its policy rate decision.
1 Unless otherwise indicated, all data cited is sourced from Bloomberg as of May 30, 2025.
Risk Information:
Investing involves risk, including risk of loss.
Diversification does not ensure a profit or guarantee against loss.
Disclosures:
Link(s) are being provided for informational purposes only. Raymond James Investment Management is not affiliated with and does not endorse, authorize or sponsor any of the listed websites or their respective sponsors. Raymond James Investment Management is not responsible for the content of any website or the collection or use of information regarding any website’s users and/or members
Index or benchmark performance presented in this document does not reflect the deduction of advisory fees, transaction charges, or other expenses, which would reduce performance. Indexes are unmanaged. It is not possible to invest directly in an index. Any investor who attempts to mimic the performance of an index would incur fees and expenses that would reduce return.
This document is a general communication being provided for informational purposes only. It is educational in nature and not designed to be taken as advice or a recommendation for any specific investment product, strategy, plan feature, or other purpose in any jurisdiction, nor is it a commitment from Raymond James Investment Management or any of its affiliates to participate in any of the transactions mentioned herein. Any examples used are generic, hypothetical, and for illustration purposes only. This material does not contain sufficient information to support an investment decision, and you should not rely on it in evaluating the merits of investing in any securities or products. In addition, users should make an independent assessment of the legal, regulatory, tax, credit, and accounting implications and make their own determinations together with their own professionals in those fields. Any forecasts, figures, opinions, or investment techniques and strategies set out are for information purposes only, based on certain assumptions and current market conditions, and are subject to change without prior notice. All information presented herein is considered to be accurate at the time of production, but no warranty of accuracy is given and no liability in respect of any error or omission is accepted. It should be noted that investment involves risks, the value of investments and the income from them may fluctuate in accordance with market conditions and taxation agreements, and investors may not get back the full amount invested. Both past performance and yields are not reliable indicators of current and future results.
The views and opinions expressed are not necessarily those of the broker/dealer or any affiliates. Nothing discussed or suggested should be construed as permission to supersede or circumvent any broker/dealer policies, procedures, rules, and guidelines.
Sector investments are companies engaged in business related to a specific sector. They are subject to fierce competition and their products and services may be subject to rapid obsolescence. There are additional risks associated with investing in an individual sector, including limited diversification.
Investing in small cap stocks generally involves greater risks, and therefore, may not be appropriate for every investor. The prices of small company stocks may be subject to more volatility than those of large company stocks.
International investing presents specific risks, such as currency fluctuations, differences in financial accounting standards, and potential political and economic instability. These risks are further accentuated in emerging market countries where risks can also include possible economic dependency on revenues from particular commodities or on international aid or development assistance, currency transfer restrictions, and liquidity risks related to lower trading volumes.
Investing in bonds involves risks that may adversely affect the value of your investment such as inflation risk, credit risk, call risk, interest rate risk, and liquidity risk, among others. The two most prominent factors are interest rate movements and the credit worthiness of the bond issuer. Investors should pay careful attention to the types of fixed income securities that comprise their portfolios and remember that, as with all investments, there is the risk of loss of capital.
Bond Ratings: Ratings are by Moody’s, S&P, and/or Fitch. Ratings provided by nationally recognized statistical rating organizations, also called ratings agencies, are appraisals of a particular issuer’s creditworthiness, including the possibility that the issuer will not be able to pay interest or repay principal. Ratings are not recommendations to buy, sell or hold a security, nor do ratings remove market risk. Securities with the same rating can actually trade at significantly different prices. In addition, ratings are subject to review, revision, suspension, reduction or withdrawal at any time, and a rating agency may place an issuer under review or credit watch. Additionally, Fitch reports are available for municipal bonds. More about ratings is available at moodys.com, standardandpoors.com, and fitchratings.com.
Definitions
The ADP® National Employment Report™ is published monthly by the ADP Research Institute® in close collaboration with Moody’s Analytics. The ADP® National Employment Report™ provides a monthly snapshot of U.S. nonfarm private sector Employment based on actual transactional data.
AI Enablers are individuals who bring together actionable knowledge about AI’s possibilities and have a deep understanding of their own business.
Artificial intelligence (AI) is technology that enables computers and machines to simulate human learning, comprehension, problem solving, decision making, creativity and autonomy.
Beta is an indicator of the price volatility of a stock or other asset in comparison with the broader market. It suggests the level of risk that an investor takes on in buying the stock. The higher the beta number, the higher the risk.
Capital expenditures, or capex, are monies used by a company to buy, improve, or maintain physical assets such as real estate, facilities, technology, or equipment, and may include new projects or investments.
Consolidation is a term used in technical analysis to describe when stocks reverse previous gains (or losses) to stay within well-defined trading levels.
Core inflation is measured by the Personal Consumption Expenditures (PCE) excluding Food and Energy, Price Index, also known as the core PCE price index, is a measure of the prices that U.S. consumers pay for goods and services, not including two categories – food and energy – where prices tend to swing up and down more dramatically and more often than other prices. The core PCE price index, released monthly by the U.S. Department of Commerce Bureau of Economic Analysis, measures inflation trends and is watched closely by the U.S. Federal Reserve as it conducts monetary policy.
Core services inflation excluding shelter, sometimes called “super core” inflation, is a version of core inflation that excludes prices for food, energy, and housing. Core inflation includes a measure of housing services, which is what households pay for rent or the equivalent for those who own their homes.
Disinflation refers to the temporary slowing of the pace of price inflation and describes what happens when the inflation rate is marginally lower over the short term. Disinflation refers only to the rate of change in the rate of inflation. In this, it is distinct from inflation and deflation, which describe the direction of prices.
Earnings per share (EPS) is calculated as a company’s profit divided by the outstanding shares of its common stock. The resulting number serves as an indicator of a company’s profitability.
Fiscal policy refers to the tax collection and spending a government uses to influence its country’s economy. Fiscal risk can arise from, among other things, excessive deficit spending, which consists of government spending over a specific period of time that exceeds the revenues that the government takes in for the same period. High levels of debt and large deficits can push interest rates higher and limit a government’s ability to respond to economic downturns.
Gross domestic product (GDP) is the total value of goods and services provided in an economy during a specified period, often one quarter or one year.
Headline inflation is the raw inflation figure reported in relation to the Consumer Price Index (CPI), which is released monthly by the Bureau of Labor Statistics (BLS).
Hyperscalers refers to the largest cloud computing providers that can provide massive amounts of computing resources and storage at enterprise scale.
The International Emergency Economic Powers Act (IEEPA) provides the President broad authority to regulate a variety of economic transactions following a declaration of national emergency. IEEPA, like the Trading with the Enemy Act (TWEA) from which it branched, sits at the center of the modern U.S. sanctions regime.
The Job Openings and Labor Turnover Survey (JOLTS) program produces monthly data on job openings, hires, and separations compiled by the U.S. Bureau of Labor Statistics. The survey’s job openings rates consider month-to-month changes in the number of job openings reported on both a state and national level.
Levered, in the context of companies that are levered to long-term trends with multi-year tailwinds, means companies with earnings that directionally follow the expansion of those themes.
Liberation Day is a term used by President Donald Trump to refer to April 2, 2025, when he announced a wide range of unexpectedly high tariffs on many U.S. trading partners, triggering a global selloff of risk assets.
Market capitalization, or market cap, refers to the total dollar market value of a company’s outstanding shares of stock.
Nonfarm payroll refers to the number of jobs in the private sector and government agencies. It excludes farmworkers, private household employees, proprietors, nonprofit employees, and actively serving military. The nonfarm payroll numbers are reported monthly to the public through the closely followed employment situation report, which details changes in unemployment by sector and demographic and new jobs added within the economy.
The United States Court of International Trade, established under Article III of the Constitution, has nationwide jurisdiction over civil actions arising out of the customs and international trade laws of the United States.
The payroll report, officially known as the Employment Situation Summary, is a monthly U.S. Bureau of Labor Statistics (BLS) report tracking nonfarm payroll employment and the national unemployment rate, with data on changes in average hourly earnings, and job trends in public and private sectors of employment. The report is based on surveys of households and employers.
The Personal Consumption Expenditures (PCE) Price Index is a measure of the prices that people living in the United States, or those buying on their behalf, pay for goods and services. The PCE price index, released monthly by the U.S. Department of Commerce Bureau of Economic Analysis, is known for capturing inflation or deflation across a wide range of consumer expenses and reflecting changes in consumer behavior.
A pullback is a temporary pause or drop in the price of a security that previously had been rising.
The Purchasing Managers’ Index (PMI) measures the prevailing direction of economic trends in the manufacturing sector. It is created by the Institute for Supply Management (ISM), and consists of an index summarizing whether market conditions as reported in a monthly survey of supply chain managers are expanding, staying the same, or contracting.
A reciprocal tariff is a tax or trade restriction that one nation imposes on another on a tit-for-tat basis in response to a trade-restriction actions taken by the nation that is the subject of the reciprocal tariff.
Under Section 232 of the Trade Expansion Act of 1962, the head of any department or agency, or any “interested party” may request that the Secretary of Commerce investigate the effects of a specific import on U.S. national security.
Section 301 of the Trade Act of 1974 grants the Office of the United States Trade Representative (USTR) a range of responsibilities and authorities to investigate and take action to enforce U.S. rights under trade agreements and respond to certain foreign trade practices.
Super core PCE, sometimes called core services inflation excluding shelter, is a version of core inflation that excludes prices for food, energy, and housing. Core inflation includes a measure of housing services, which is what households pay for rent or the equivalent for those who own their homes.
The acronym TACO, meaning “Trump always chickens out,” describes an investment approach in response to Trump’s tariff policies. TACO trade describes many investors’ strategy to buy into the market that dips when Trump announces steep tariffs on the assumption that he will back off his tariff order, and the market will rebound.
Tailwind is a term used to describe events or market forces that exert a positive influence on an investment’s performance. The opposite of a tailwind is a headwind, which contributes to an investment’s underperformance.
U.S. exceptionalism or American exceptionalism is an idea centered on the notion that the United States is a unique and even superior nation as a result of historical, ideological, religious, and/or, in the context of finance, economic reasons. Proponents of American exceptionalism often expect or advocate for the United States to occupy or play a leading role in global affairs.
Indices
The CBOE Volatility Index, or VIX, is a real-time market index representing the market’s expectations for volatility over the coming 30 days. Investors use the VIX to measure the level of risk, fear, or stress in the market when making investment decisions.
The MSCI ACWI (All Country World Index) ex USA Index captures large- and mid-cap representation across 22 of 23 developed markets countries (excluding the United States) and 24 emerging markets countries. With 2,228 constituents, the index covers approximately 85% of the global equity opportunity set outside the United States. Developed markets countries include Australia, Austria, Belgium, Canada, Denmark, Finland, France, Germany, Hong Kong, Ireland, Israel, Italy, Japan, Netherlands, New Zealand, Norway, Portugal, Singapore, Spain, Sweden, Switzerland and the U.K. Emerging markets countries include Brazil, Chile, China, Colombia, Czech Republic, Egypt, Greece, Hungary, India, Indonesia, Korea, Kuwait, Malaysia, Mexico, Peru, Philippines, Poland, Qatar, Saudi Arabia, South Africa, Taiwan, Thailand, Turkey and United Arab Emirates.
The S&P 500 Index measures changes in stock market conditions based on the average performance of 500 widely held common stocks. It is a market-weighted index calculated on a total return basis with dividend reinvested. The S&P 500 represents approximately 80% of the investable U.S. equity market.
The Russell 1000® Index measures the performance of the 1,000 largest companies in the Russell 3000® Index, which represents approximately 98% of the total market capitalization of the Russell 3000® Index.
London Stock Exchange Group plc and its group undertakings (collectively, the “LSE Group”).© LSE Group 2025. FTSE Russell is a trading name of certain of the LSE Group companies. Russell® is a trade mark of the relevant LSE Group companies and is used by any other LSE Group company under license. All rights in the FTSE Russell indexes or data vest in the relevant LSE Group company which owns the index or the data. Neither LSE Group nor its licensors accept any liability for any errors or omissions in the indexes or data and no party may rely on any indexes or data contained in this communication. No further distribution of data from the LSE Group is permitted without the relevant LSE Group company’s express written consent. The LSE Group does not promote, sponsor, or endorse the content of this communication.
M-750550 Exp. 10/2/2025
